Trend Analysis
About the analysis
This out-of-the-box narrative app generates a narrative that analyzes the changes in trend of a measure over time. The narrative highlights significant shifts, and drills down through multiple dimensions. For example, an analysis of the changes in Sales by Month, broken down by Country, Product, and Market.
Details covered in the analysis
If the value of the measure changes by more than a user-defined threshold over the selected time period, it is considered a trend. The user defines this threshold using the Trend change % option: see Configuration options for details.
Consecutive time periods with trends moving in the same direction are merged into one trend.
The narrative includes:
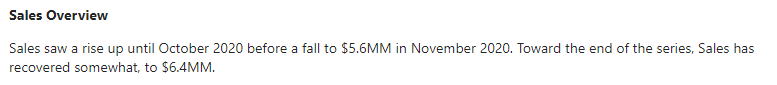
an overview section that describes up to three changes in the trend of a measure (rise to fall, fall to level, fall to rise, etc.). For example:
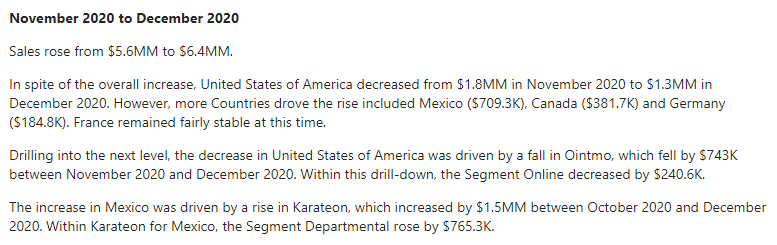
a section for each of the trends mentioned in the overview, drilling down by up to three dimensions, which includes:
a paragraph for the first level of drilldown (e.g. Country) that describes dimension instances (e.g. United States of America and Canada) based on the patterns they display, and whether they drove or offset the change in the overall value of the measure.
paragraphs covering the second and third levels of drilldown (e.g. Product and Segment) that describe dimension instances (e.g. Ointmo and Karateon, and Online and Departmental), reporting on the single most significant changes at those levels.
For example:
Note
The order of drilldown is determined by the order of dimensions set in Step 1.
The app attempts to describe as much detail as possible, but when there is too much to describe the narrative focuses on the later time periods in the series. If you want to analyze a specific time period, select specific dates as a subset of the full dataset.
Note
Only the Important things narrative length is available for this app in Step 3.
Required dimensions and measures
This app can analyze:
up to two time dimensions*, up to three non-time dimensions, and exactly one measure.
Minimum requirement: one time dimension* and one measure.
*Time dimension requirements for each analysis period:
Analysis period | Required date fields |
|---|---|
Year |
|
Quarter |
|
Month |
|
Important
For each time dimension, the Entity Type field must be set to DateTime in Step 1 of the wizard.
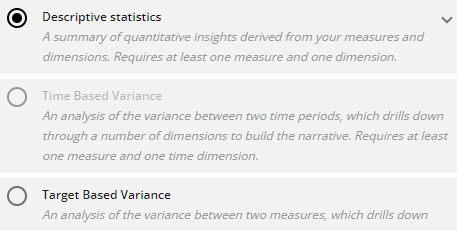
If your data selection does not meet the specific requirements for a particular app, that app is grayed out and unavailable for selection. For example, if no time dimensions have been configured, the Time-Based Variance app is disabled:
 |
Configuration options
The following options are available to configure in the Configure Narrative wizard:
OPTION | DESCRIPTION | LOCATION |
|---|---|---|
Step 2: Measure | Select the measure you want to analyze. Default: | 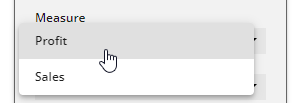 |
Step 2: Period | Select a time period to analyze. The time dimensions in your data selection must include the period you select here — either as a Date field, or as a Month, Quarter, or Year field. Default: TipIn order to be recognized as a time dimension, the Entity Type of the dimension must be set to | 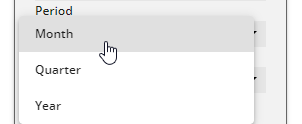 |
Step 2: Trend Change % | Set the percentage value at which a change between two consecutive values of a measure is considered a new trend. The slider is adjusted in increments of 1%. Default: | 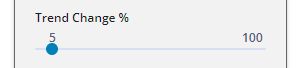 |
