1. Tell me about your data
In Step 1 of the wizard, you characterize and prioritize the data fields you have chosen to analyze in your narrative.
Tip
You must select at least the minimum number of data fields required for the NLG App you wish to use. The minimum requirements for each NLG app are described in the Required dimensions and measures section for that app.
Select data fields
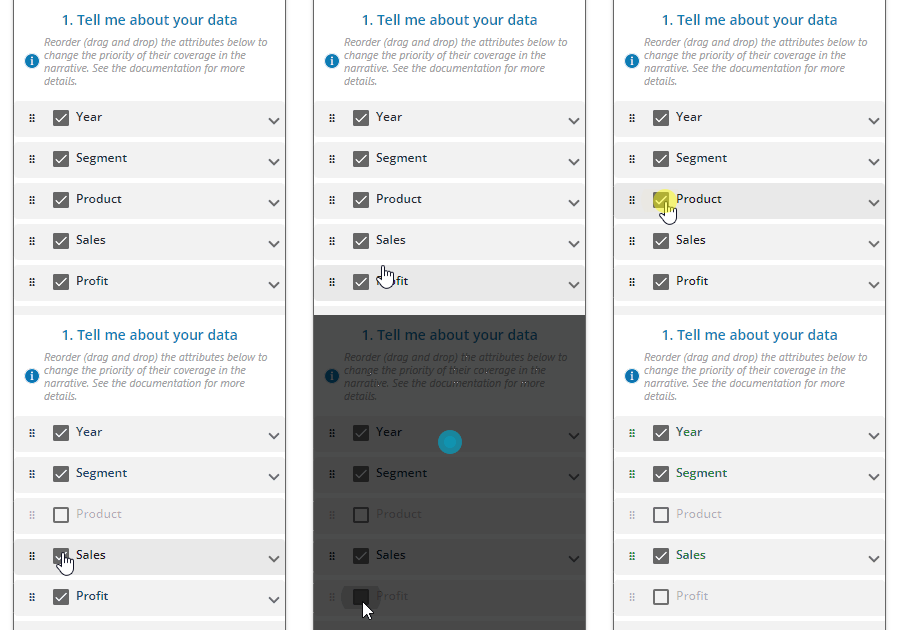
The initial list of data fields contains all columns in the data range you select for the narrative. You can remove fields from the analysis by unchecking the box in the relevant field header.
 |
Configure data fields as dimensions or measures
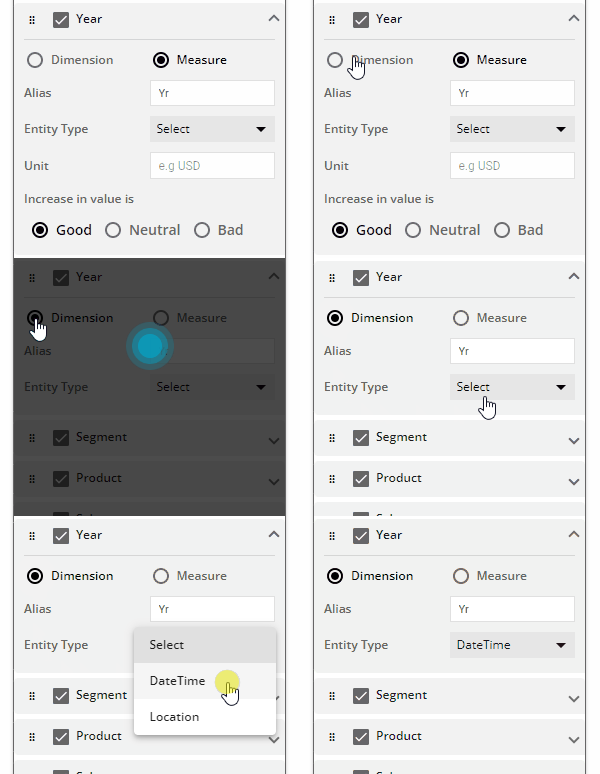
Arria for Excel automatically categorizes each field in your selected data as a dimension or a measure, according to how they've been formatted in Excel.
You can recategorize a dimension as a measure, and vice versa. To categorize a dimension as a time dimension, set the Entity Type field to DateTime.
 |
Configure data attributes
Further characterize your selected dimensions and measures by adjusting their attributes.
Dimension attributes
OPTION | DESCRIPTION | LOCATION |
|---|---|---|
Alias | Adds an alternative name for the field (if desired). For example, you could give the Segment field the alias Default: | 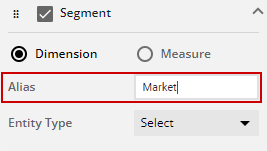 |
Entity Type | Ensures appropriate handling of dates and locations in the narrative. Set the Entity Type field to For example, when you set Entity Type to If neither of these entity types applies, leave this selection blank. Default: | 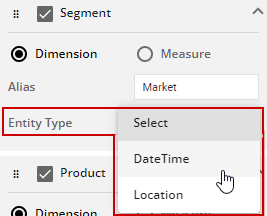 |
Measure attributes
ATTRIBUTE | DESCRIPTION | LOCATION |
|---|---|---|
Alias | Adds an alternative name for the field. For example, the Sales field could be given the alias Default: | 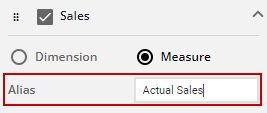 |
Entity Type | Ensures appropriate language and formatting is used in the narrative. For example, when Default: | 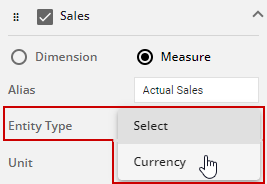 |
Unit | Defines the appropriate unit for your measure (e.g. A number of ISO 4217 currency codes are supported. Select the code for the currency you want to use in the narrative. For example, when the Unit field is set to Default: | 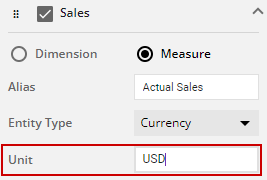 |
Increase in Value is | Characterizes an increase in value for each of your measures as a positive, neutral, or negative change: Select Good, Neutral, or Bad. For example, an increase in Sales is a positive change, whereas an increase in Cost of Goods Sold is a negative change. Default: | 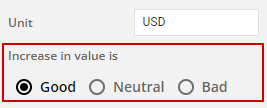 |
Prioritize data fields
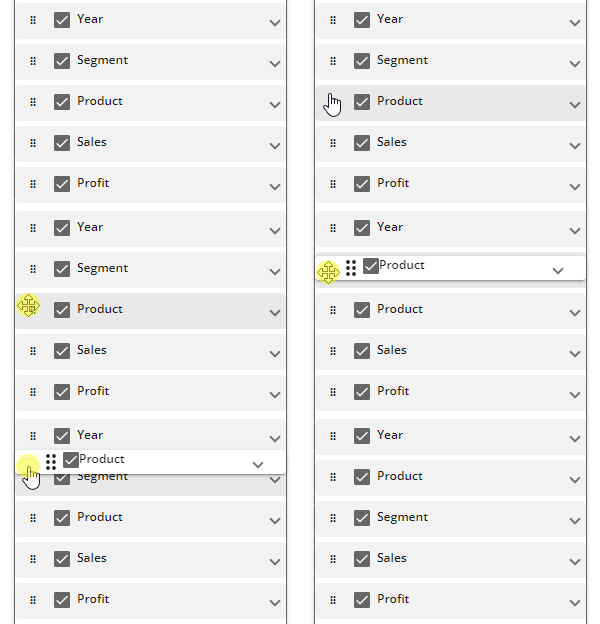
The higher the position of a dimension or measure, the higher its priority for coverage in the generated narrative.
Fields are initially prioritized in the same order as your columns in Excel. Drag and drop fields to change their priority order to suit the narrative you want to generate.
 |
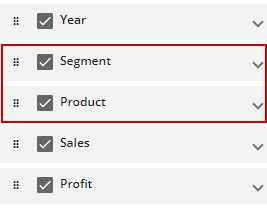
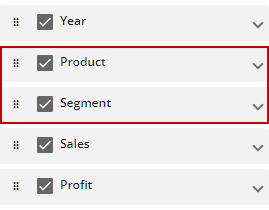
Prioritizing non-time dimensions
The priority order for non-time dimensions is important for apps that perform drilldown analysis. For example:
 |  | |
 |  |
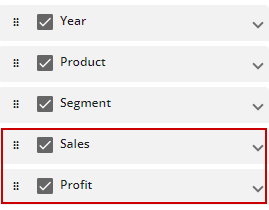
Prioritizing measures
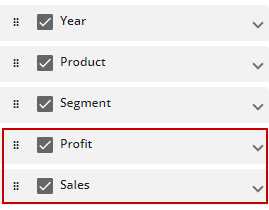
The priority order for measures is important for apps that describe each measure in turn. For example:
 |  | |
 |  |