Add a narrative tile and select your data range
You can now add a narrative tile to the Arria for Excel task pane and select the data you'd like to analyze.
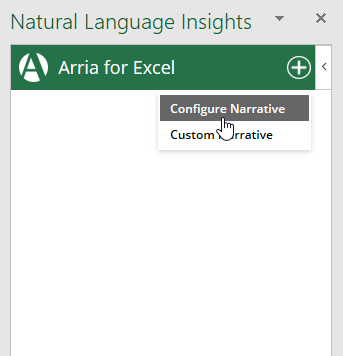
At the top right of the add-in, click on the Plus sign icon, then click on the Configure Narrative option to add a Configure Narrative tile to the task pane.
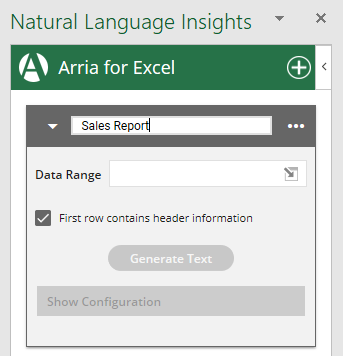
Each Configure Narrative tile you add is given the same name by default: Configure Narrative.
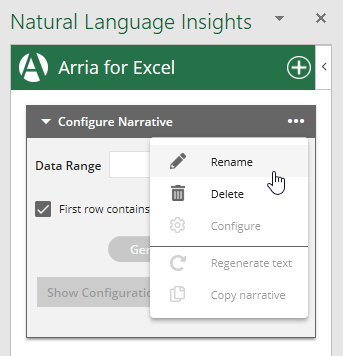
Click on the ellipsis (three dots) at the top right, click Rename, and change the name to Sales Report:
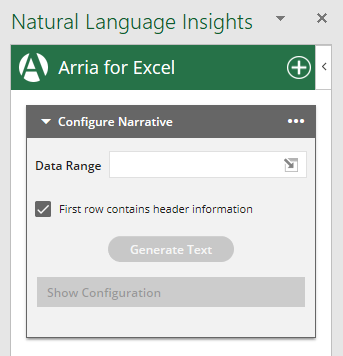
You have two options for selecting the data range you want to report on. Choose one of the following:
In the Data Range field, type the data range manually.
e.g.
B3:F63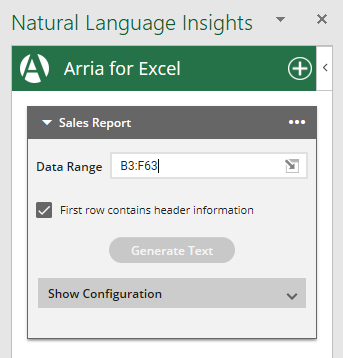
On the right of the Data Range field, click on the Select data range icon.
You see a message asking you to select your data source.
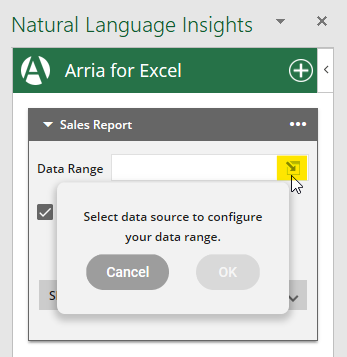
Select the contents of the pivot table by selecting any cell in the table and then pressing Ctrl + Shift + *.
Now click OK.
Tip
Click the Select data range icon before selecting your data range.
If a data range is already selected when you click the icon, you must reselect it in order to activate the OK button and continue.
Click on the narrative tile header to minimize the tile. You see the workbook and data range you linked to the narrative.
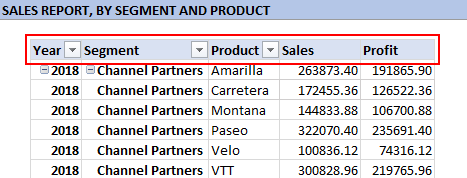
In this example, the data range is
B3:F63on the By Segment, Product worksheet: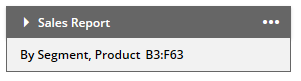
Important
Each narrative tile is valid only in the worksheet it is added to.
Only narrative tiles associated with the currently active worksheet are visible in the task pane.
See Data selection and narrative placement for more information.
Click the narrative tile header to maximize it.
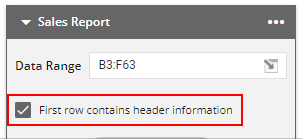
If the first row of your data range contains header information, as in this example, leave the First row contains header information field checked.
You're now ready to tell the add-in how to characterize and prioritize your data.
