Data selection and narrative placement
This topic discusses how best to format and select the data you wish to describe in your narratives, and where the generated narratives can be placed in your workbook.
Supported table types
Configure Narrative option
When using the Configure Narrative option and our out-of-the-box narratives, your data must be laid out in contiguous tables (no empty cells, rows, or columns).
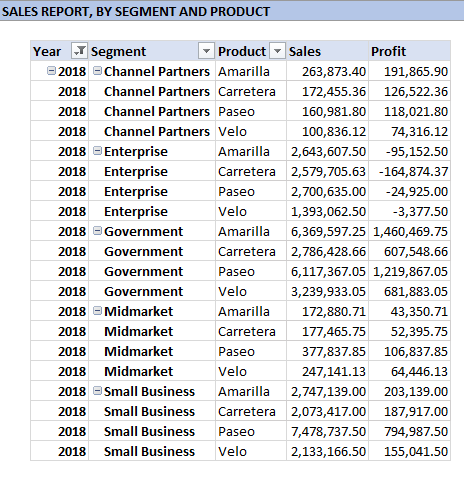
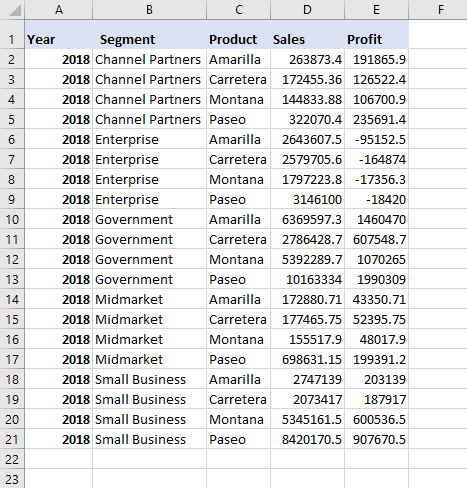
Pivot tables laid out in tabular form (or pivot-like, raw data tables) with all item labels repeated, and with no subtotals or grand totals, are ideal. They should contain only those fields you wish to report on.


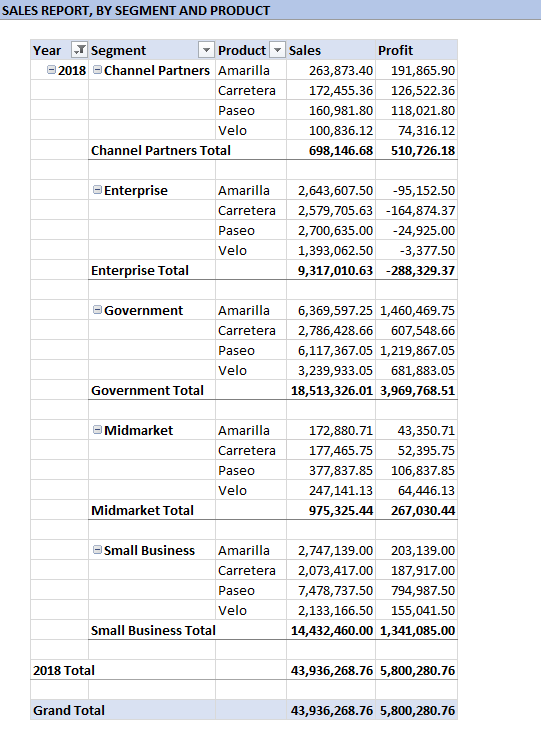
To convert any pivot table to the supported format:
Click anywhere in the pivot table. You should now see the Design tab on the ribbon.
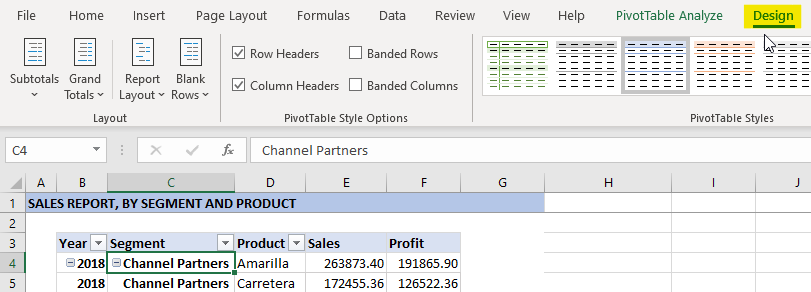
On the Design tab, in the Layout group, choose the following options:
Subtotals > Do Not Show Subtotals
Grand Totals > Off for Rows and Columns
Report Layout > Show in Tabular Form
Report Layout > Repeat All Item Labels
Blank Rows > Remove Blank Line after Each Item
Custom Narrative option
When using the Custom Narrative option, you can work with any type of table in Excel.
Using JavaScript and the Edit Mapping Script feature, you can transform any data table into the desired format before it is passed to the Studio project. For example, you can add repeated values for each category, or remove empty rows.
Table-type Studio projects: this project type requires that your input data is transformed into the desired format using the Edit Mapping Script feature.
JSON-type Studio projects: this project type offers the most flexibility. Any Excel table can be used for the input data range, without the need to transform your data using the Edit Mapping Script feature, as long as the Studio project has been suitably configured to handle it.
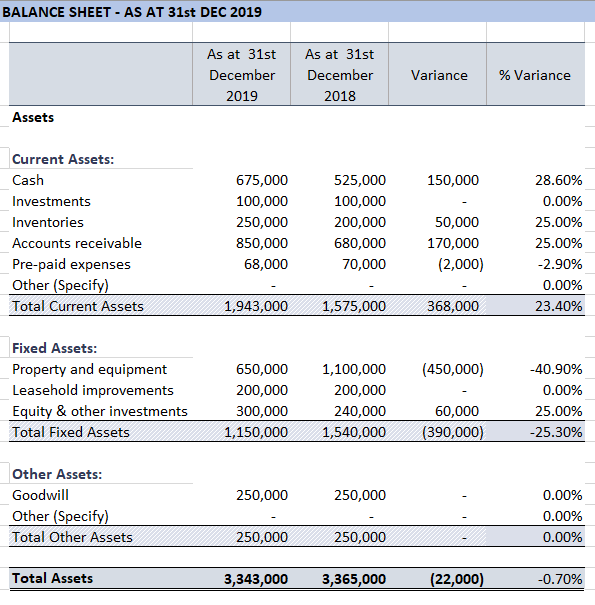
The Balance Sheet showcase project demonstrates the use of mapping scripts to transform input data before it is passed to a Studio project.
Note
Using the mapping scripts feature requires a sound knowledge of JavaScript and NLG Studio.
Please contact us if you require support with using this feature.
Selecting your data range
You have two options for selecting the data range you want to report on. Choose one of the following:
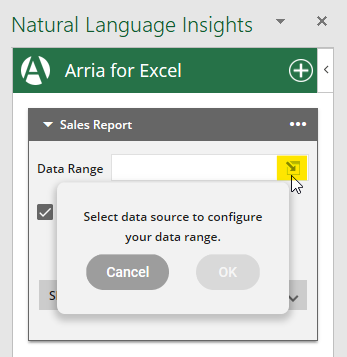
On the right of the Data Range field, click the Select data range icon.
You should see a message asking you to select your data source.
Select the contents of the pivot table by selecting any cell in the table and then pressing Ctrl + Shift + *.
Click OK.
Important
Click the Select data range icon before selecting your data range.
If a data range is already selected when you click the icon, you must reselect it in order to activate the OK button and continue.
In the Data Range field, type the data range manually.
E.g.
B3:F63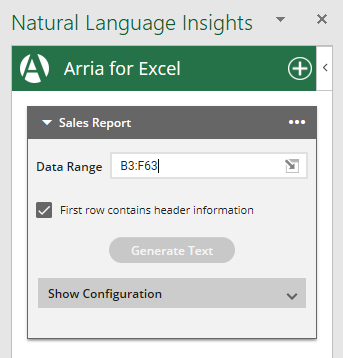
Note
The narrative must be manually regenerated when the data it describes is changed, or the table is moved. It is not automatically refreshed.
Click the ellipsis in the top-right corner of the narrative tile, and select Regenerate text.
Reducing the size of your data range
The time it takes to generate a narrative increases in line with the size of your selected data range.
We recommend reducing the size of the data range by creating pivot tables containing only the dimensions and measures required for your narrative, and aggregating those measures. See Supported table types for more information.
You can further reduce the size by using pivot table filters before you make your selection.
See the release notes for details of issues that may arise when your data range is very large.
Filtering data
If the selected data range is in the form of a pivot table, you can use filters to select subsets of your data.
To generate a narrative from filtered data:
Filter the data in the pivot table.
Reselect the data range in the narrative tile.
Regenerate the narrative.
Note
To use filters with the add-in, the selected data range must be in the form of a pivot table.
Narrative placement
Each narrative tile is tied to the worksheet that is active when the tile is added, and only narrative tiles associated with the currently active worksheet are visible in the task pane.
To view which worksheet and data range a narrative is linked to, minimize the narrative tile by clicking its header. The example below shows a narrative that is linked to the By Segment, Product worksheet and B3:F63 data range:
Note
Narrative text boxes can be copied and pasted to other worksheets but they will not be updated when the narrative is regenerated. Only the original text box will be updated.
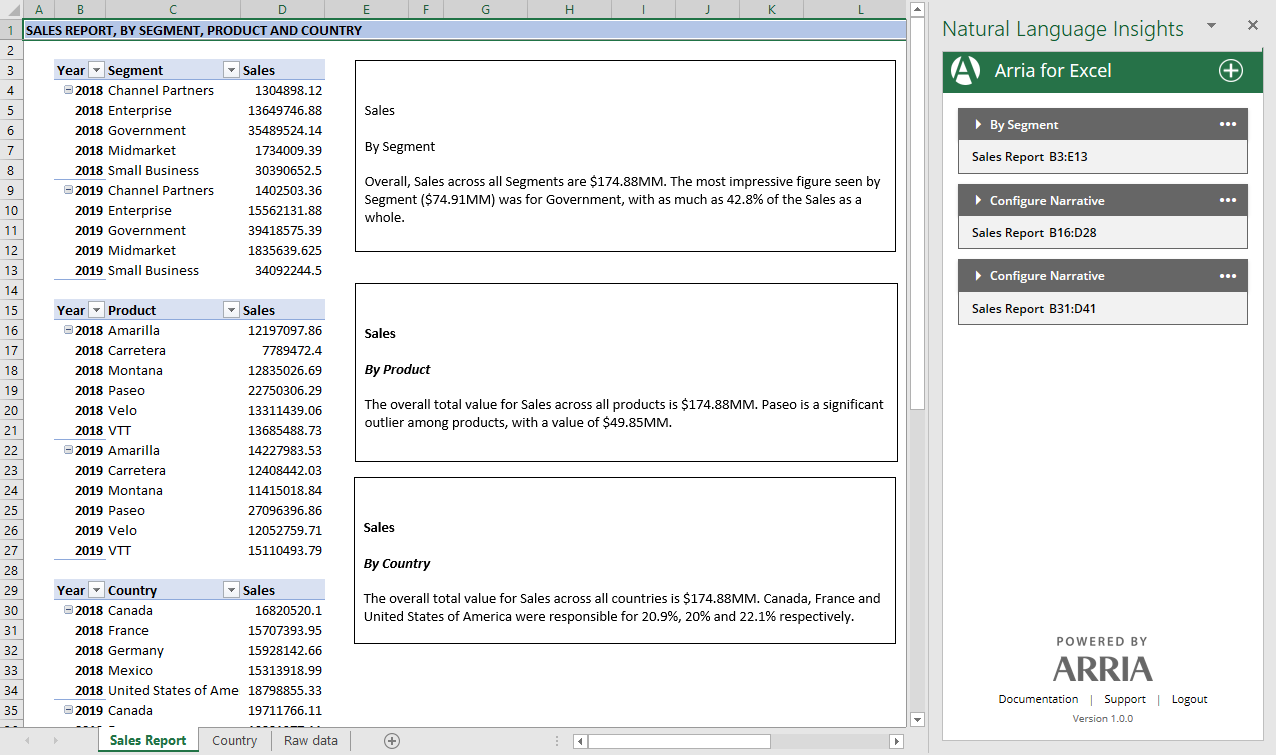
Adding multiple narratives
You can add multiple narratives to one worksheet. Each narrative can describe a different table, provided that all of the tables are situated in that one worksheet.
This simple example shows three narratives, generated from three separate pivot tables in the same worksheet: