Balance Sheet showcase
A balance sheet analysis, created using Arria for Excel
Overview
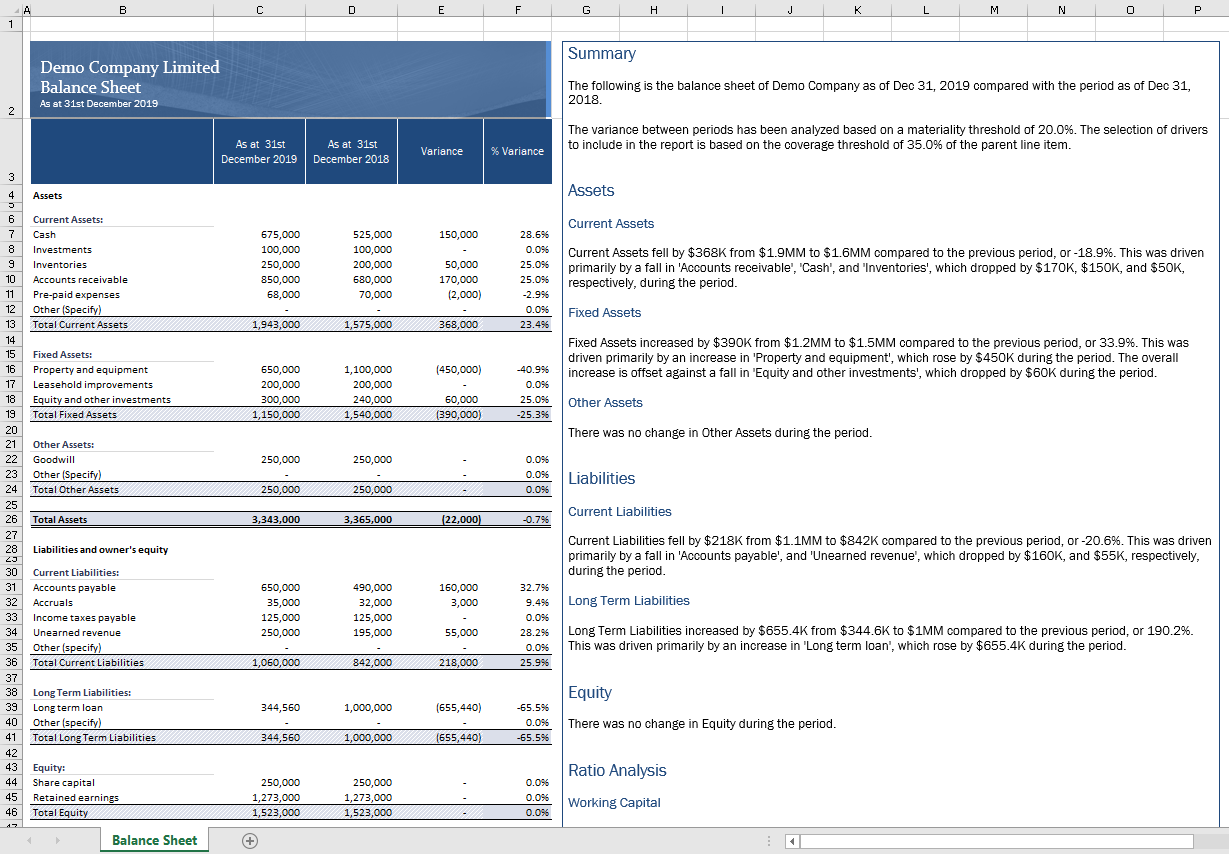
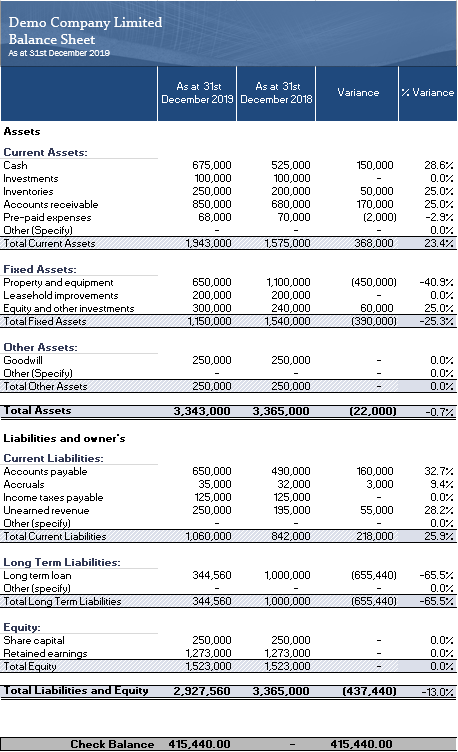
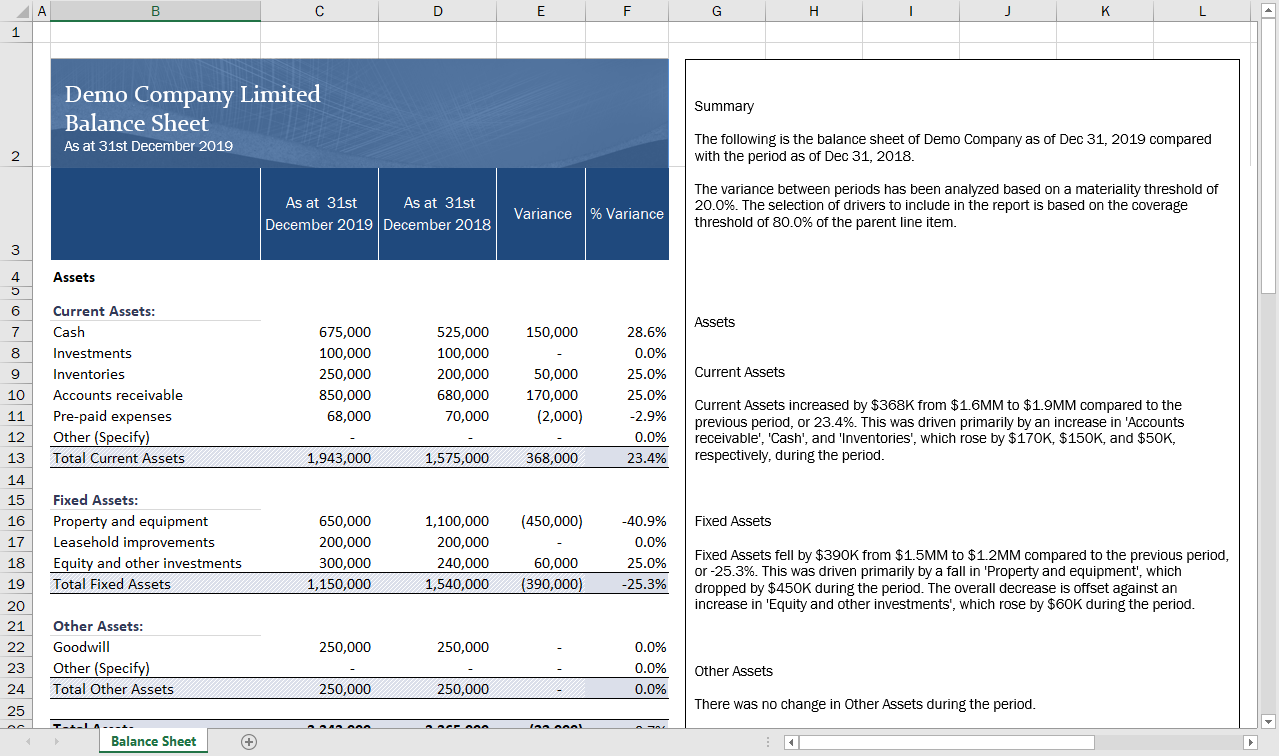
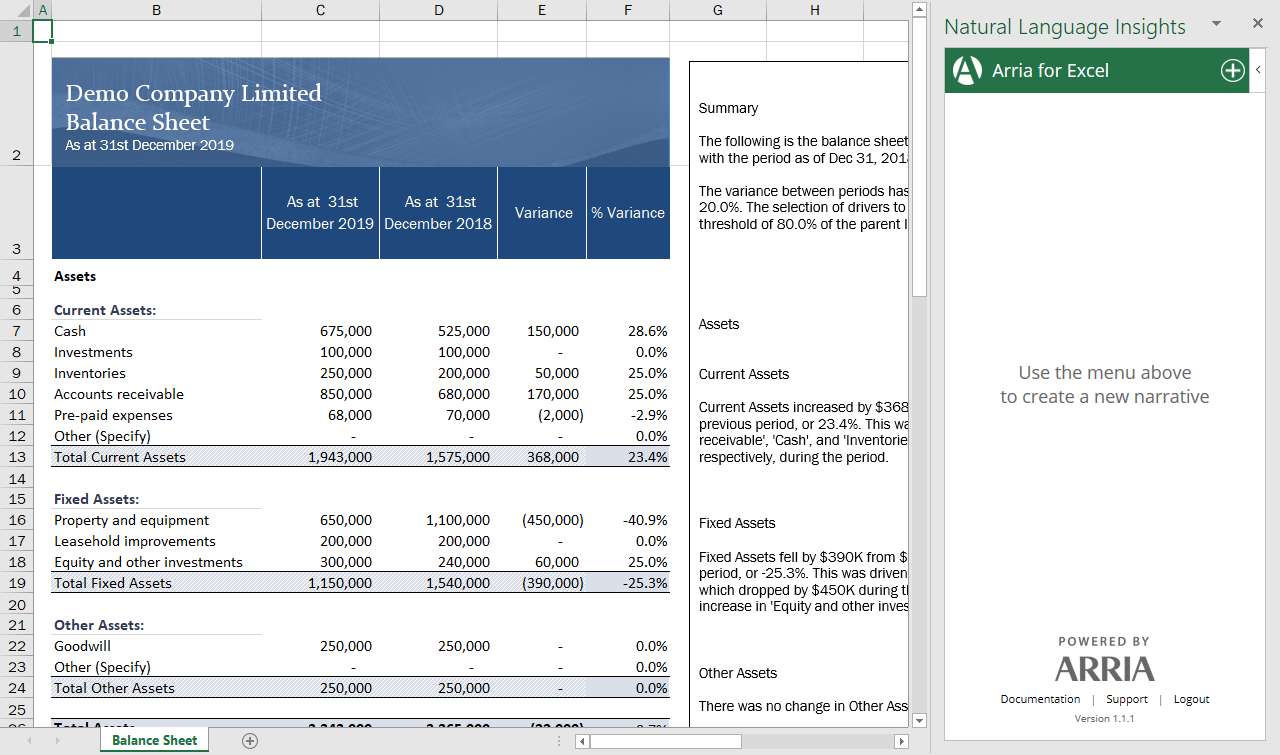
This workbook contains a typical balance sheet detailing the assets, liabilities and owner's equity of a company across two quarters. Arria for Excel has been used to add an expert, automatically generated variance and ratio analysis of the financial data.
The add-in's Custom Narrative option allows you to configure and vary narratives you create in Arria NLG Studio, and use them to describe any appropriately formatted dataset. In this showcase, both the materiality and coverage thresholds can be modified by the workbook viewer to dynamically vary the narrative.
The narrative for this showcase is generated using a JSON-type Studio project.
Note
In order to interact with the narratives in the showcase workbook, first install the Arria for Excel add-in.
Highlights
Variance and ratio analysis
The comprehensive variance analysis across the two periods is broken down by the company's assets, liabilities and owner's equity, and the key drivers and offsets are identified.
Additionally, ratio analysis gives key insights into the company's working capital and current ratio (a common metric for assessing a company's short-term liquidity) .
Dynamically vary the narrative
Produce variations of the narrative using the Arria add-in's Parameter Controls feature. Dynamically change the narrative according to which values you select.
See How to use this showcase for details.
Work with any Excel table format using mapping scripts
The Arria for Excel add-in saves the user-selected Excel table data as either CSV data or a JSON object, depending on the type of Studio project chosen to generate the narrative. The CSV data or JSON object can be viewed in the View Dataset in CSV or View Dataset in JSON sections of the Custom Narrative option.
The Balance Sheet showcase calls a custom, JSON-type Studio project. At run-time, the Excel data is passed as a JSON object to the Studio project and a narrative describing the data is generated.
When working with non-standard Excel table formats, JavaScript can be used with the add-in's Mapping script feature to transform the data into the format expected by the Studio project.
In order to transform the data in the JSON object:
First, the
getData()method is used to fetch the JSON object.The JSON object is then transformed into the format expected by the custom Studio project: blank lines and empty column headers are removed, hierarchies are flattened, etc.
Finally, the transformed JSON object is saved using the
setData()method.
The newly transformed JSON object is displayed in the View Dataset in JSON section and will be passed to the Studio project at run-time.
Reuse narratives in other reporting tools
Present the generated narrative in your preferred reporting tool, such as PowerPoint or email.
How to use the showcase workbook
Begin by downloading the Balance Sheet showcase workbook and opening it in Excel.
Next, install the Arria for Excel add-in and sign in to your Arria account.
Don't have an Arria account? See Arria accounts and subscription plans for details.
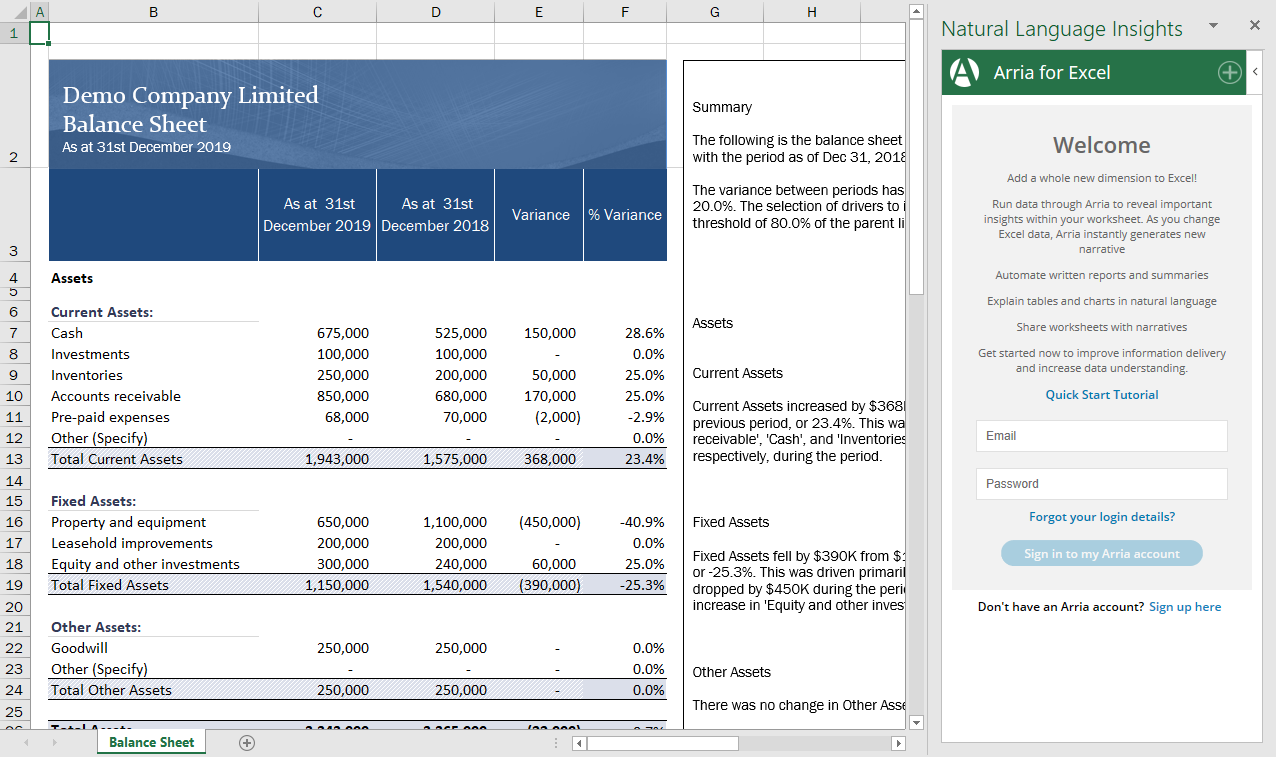
In the Arria for Excel add-in task pane, you see the Balance Sheet narrative tile.
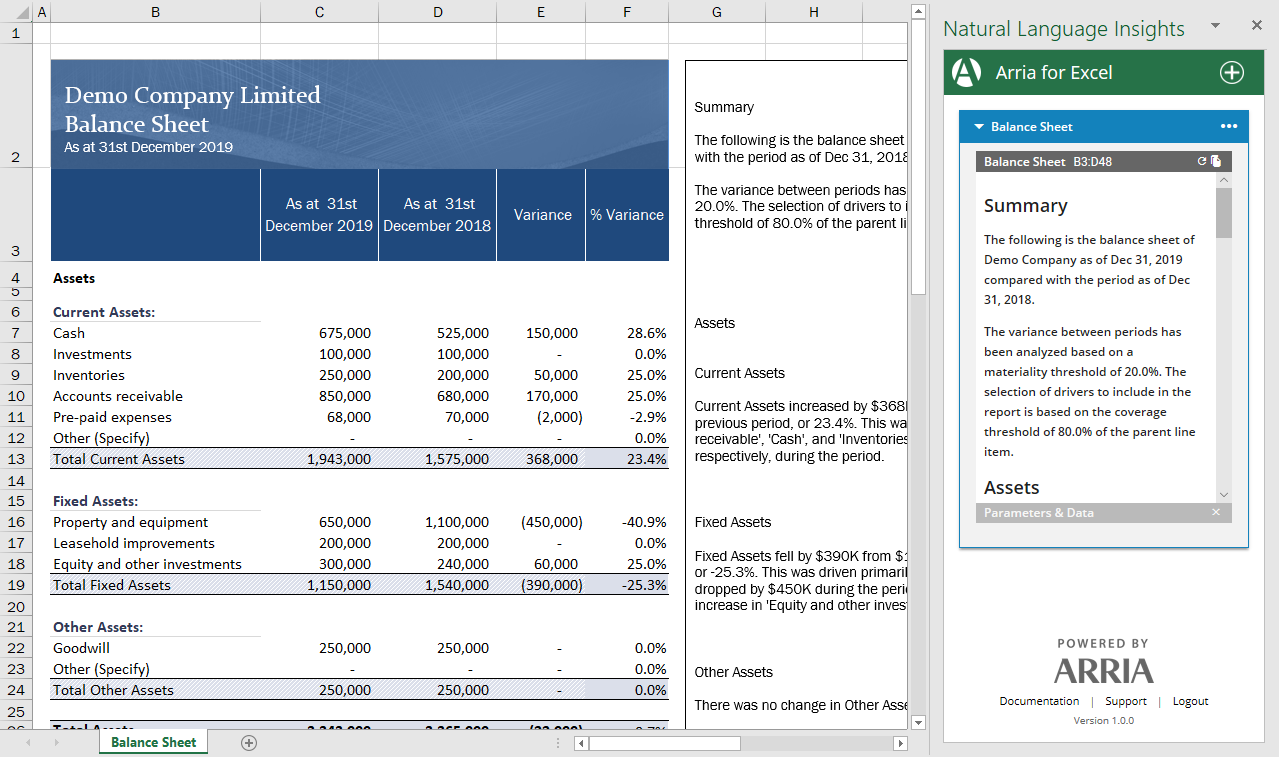
You can now interact with the narrative, as described below.
Note
If the Balance Sheet narrative tile is not visible, it may be due to this known issue. Please contact our Support team for assistance with this showcase project.
Parameter controls
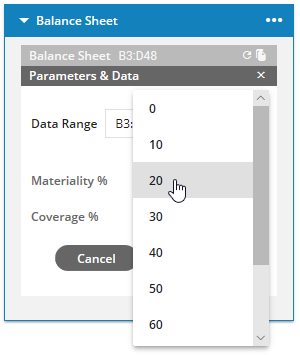
Using the Parameter Controls feature, workbook viewers can dynamically vary the narrative according to the values they select.
In the Balance Sheet showcase, the following parameters are available:
Materiality %: minimum percentage of variance required to include a movement in the narrative.
Coverage %: minimum percentage of the overall expenditure required to include a driver or offset in the narrative.
To vary the narrative using the Parameter Controls feature, first click Parameters & Data at the bottom of the preview pane in the narrative tile. Then select the values you want from each parameter field and click Apply.
Questions?
We're here to help. If you have any question about the Arria for Excel add-in or our showcase projects, please contact us.
