TRY IT WITH YOUR DATA: Automated Financial Reporting
An automated consolidated financial report, created for accountants using Arria for Excel
Overview
Aimed primarily at accountants, this workbook is more than a showcase: it is an end-to-end, automated solution for consolidated financial reporting. With this workbook, you can generate written reporting as a profit and loss statement, a cash flow statement, and a balance sheet — automatically from your data. This pre-formatted Excel workbook demonstrates how data from multiple Excel worksheets can be combined into a single report automatically, by using Excel macros, some clever analytics and the Arria for Excel add-in. This workbook, also referred to as 'Arria for Accountants', combines advanced financial analytics with Arria's NLG functionality to generate a report in expert financial language alongside attractively presented tables and charts, saving accounting professionals hours of time, while minimizing the risk of introducing errors at the report-writing stage. Included is a detailed tutorial, which guides users step-by-step from pasting data into a worksheet to printing the complete financial report. NoteThe tutorial assumes advanced Excel skills and a good understanding of working with data. |
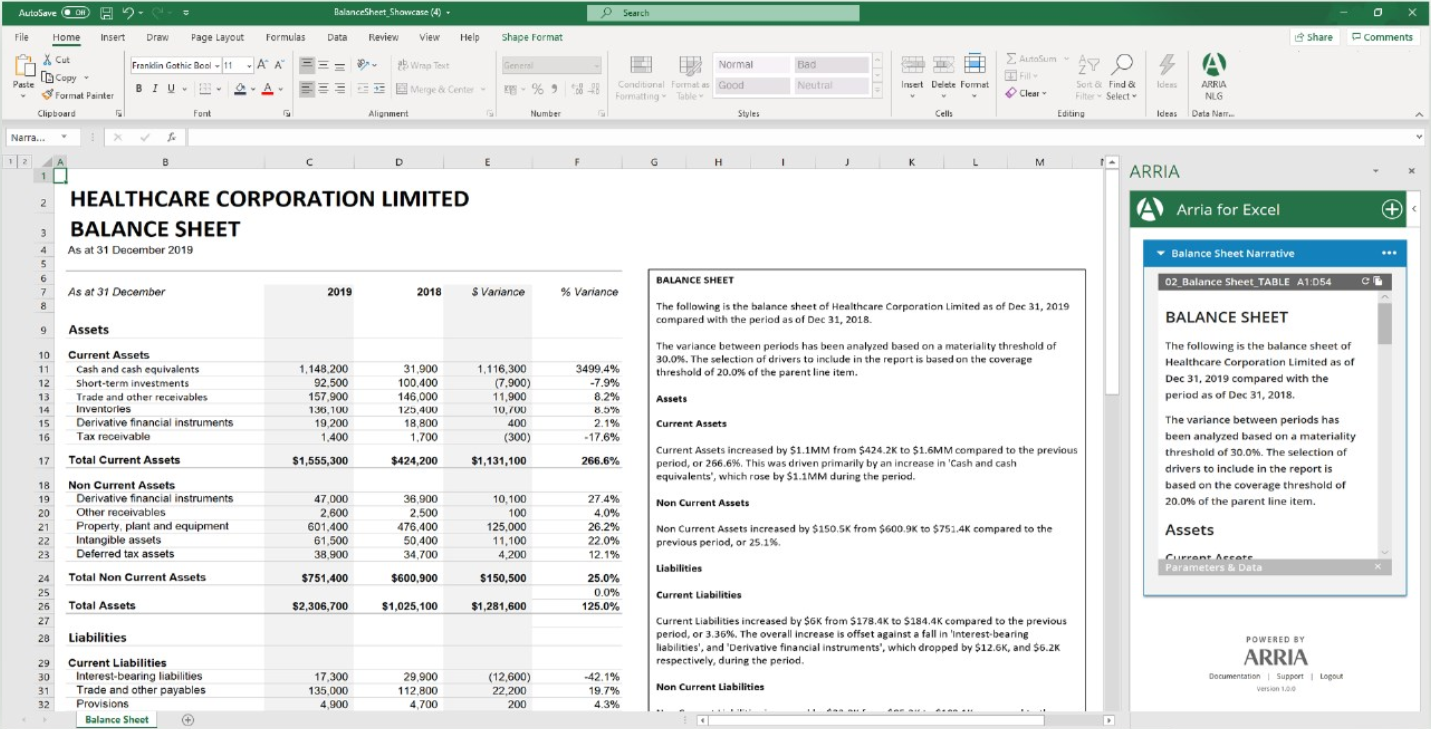
The screenshot below shows the balance sheet with written reporting alongside it, and the Arria for Excel add-in, which is used to generate the text, on the right side of the screen.
Note
In order to interact with the narratives in the showcase workbook, first install the Arria for Excel add-in.
Highlights
Combine data from different worksheets into a single consolidated financial report in only five steps
Transform your financial data into attractively presented tables and auto-generated text to provide analysis and explanatory insights. Open as a fully formatted and ready-to-distribute report in PDF format.
The in-workbook tutorial will show you how in five easy-to-follow steps.
Use your own logo and terminology, and customize the report to suit your needs
Customize your financial report by inserting your (or your customer's) company name and logo, by choosing reporting periods, and by choosing formatting styles for currency and numbers.
Choose how much detail to include in your report
Choose from three report lengths to cater to different audiences: Summary, Pro, and Pro+.
Re-run the report with new data at any time
Paste new data into the workbook and re-run the report. All tables, charts, and narratives are updated automatically using the new data — while all your report settings remain the same.
How to use the showcase workbook
If you have not already done so, install the Arria for Excel add-in and sign into your Arria account.
Don't have an Arria account? See Arria accounts and subscription plans for details.
You can sign up for a free 14-day trial of Arria for Excel from this link.
Download the showcase and open it in Excel. IMPORTANT: Enable editing, then enable macros.
The first time you open the workbook, the splash screen prompts you to open the in-workbook tutorial.
Click SHOW ME to open the tutorial. This unhides tabs T1 to T6 of the showcase workbook with step-by-step instructions:
T1: The process of creating a financial report from data
T2: Pasting financial data into the workbook
T3: Mapping the data, more complex data mapping, and troubleshooting
T4: Generating the income statement, balance sheet, cash flow report, and the complete financial report
T5: Using your own data to generate a financial report: exporting and preparation
T6: Where to go for more information
Follow the in-workbook tutorial to learn to create a financial report from sample data. The tutorial is on tabs T1 to T6 of the showcase workbook. Alternatively, watch our video tutorials. See Video tutorials.
Next, use your own data to create your financial report. See How to use the showcase workbook with your own data
Note
The tutorial closes automatically once you have completed it.
You can re-open the tutorial at any time using the TUTORIAL button on the MASTER PRINT PAGE worksheet.
Alternatively, unhide tabs T1 to T6 of the showcase workbook. These tabs contain the tutorial.
Video tutorials
Introduction: from data to financial reportSee a completed financial report and learn the steps to create it. | Configuring the report using the MASTER INPUT PAGELearn to configure the financial report and to set the report length using the MASTER INPUT page. | |
Importing and mapping dataLearn to import your data to map it to the Consolidated Financial Reporting (also referred to as Arria for Accountants) template. | Checking totals and refreshing narrativesLearn to cross-check your totals to make sure the data input and mapping has been done correctly, and to refresh all narratives before you generate the financial report. | |
Generating the financial reportLearn to generate the financial report. | Preparing for the next time periodLearn to update and re-generate the financial report with new data. | |
How to use the showcase workbook with your own data
To generate the financial report from your own data, follow the steps below:
Prepare the workbook
Import and map your data
Customize and generate the report
For instructions on how to carry out each step, refer to the in-workbook tutorial.
Note
To include a cash flow statement in your financial report, add data to the cash flow worksheet.
If a cash flow statement is not required, leave the cash flow worksheet blank.
Step 1: Prepare the workbook
If your worksheet already contains data (e.g. from a previous report or the tutorial) do the following:
Delete the data from all DATA MAP worksheets. Only clear data from cells that have no shading. Shaded cells, for example Column B, are auto-populated from a formula. Deleting data from these cells will stop the worksheet from functioning.
Click the RESET SHEET buttons on all TABLE worksheets to clear all data and mapping.
On the MASTER INPUT PAGE, set the reporting type to 'COGS included' or 'COGS excluded' for the income statement, and to 'direct reporting' or 'indirect reporting' for the cash flow statement (if included). This displays the correct tables for data mapping used in Step 4.
Step 2: Import and map your data
Export your data from your accounting system (e.g. NetSuite).
You need separate datasets for income statement, balance sheet and - if required - cash flow statement.
Bring your data into the correct format, as described in the in-workbook tutorial.
Paste your data into the relevant DATA MAP worksheets for income statement, balance sheet and - if required - cash flow statement.
Note
The DATA MAP worksheets are: '01_INCOME STATEMENT_DATA MAP', '02_BALANCE SHEET_DATA MAP', and '03_CASH FLOW_DATA MAP'.
Map your data to the rows in the corresponding TABLE worksheets.
Note
The TABLE worksheets are: '01_INCOME STATEMENT _TABLE_INC' (if you selected 'COGS included' on the MASTER INPUT PAGE), or '01_INCOME STATEMENT_TABLE_EXC' (if you selected 'COGS excluded'), '02_BALANCE SHEET_TABLE'.
If you are including the cash flow report, map to'03_CASH FLOW_TABLE_DIRECT' (if you selected 'direct' reporting on the MASTER INPUT PAGE) or '03_CASH FLOW_TABLE_INDIRECT' (if you selected 'indirect' reporting). Else, omit the mapping step for cash flow.
Step 3: Customize and generate the report
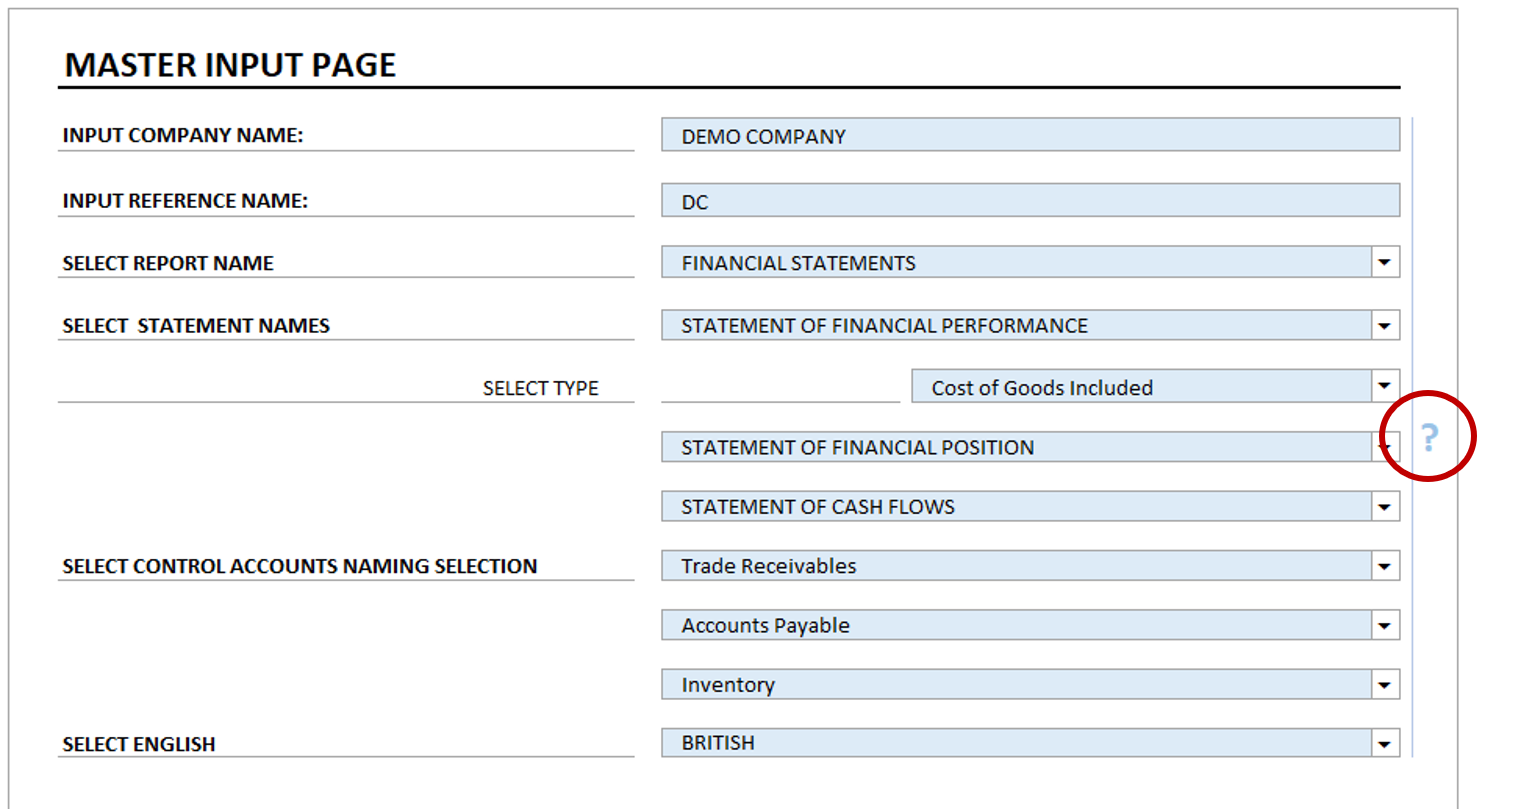
Use the MASTER INPUT PAGE to customize report headers, terminology, and the report length.
Use the context sensitive help to find out what each setting on the MASTER INPUT PAGE means. Click on the question marks next to the input fields, see screenshot below:
Generate the individual narratives for income statement, balance sheet, and cash flow statement on their respective TABLE worksheets, using the Arria for Excel add-in.
Generate the overall financial report using the GENERATE REPORT button on the MASTER PRINT PAGE worksheet.
Questions?
We're here to help. If you have any questions about the Arria for Excel add-in or our showcase projects, please contact us.
