Configure the data to be analyzed
In Step 1 of the wizard, on the 1. Tell me about your data page, you characterize and prioritize the data fields you have selected for your narrative.
When selecting and configuring the data fields to be analyzed, you must consider the data requirements for your chosen app. In this tutorial, you'll generate a narrative using the Descriptive Statistics app.
The Descriptive Statistics app requires at least one non-time dimension and one measure. The data you've already selected includes two non-time dimensions (Segment and Product), two measures (Sales and Profit), and a time dimension (Year). Therefore, your selection already meets the minimum field requirements for the app.
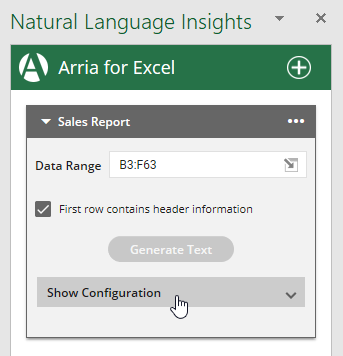
Click anywhere on the Show Configuration header to expand the section and open the three-step configuration wizard.
Note
Until a data range has been selected, the Show Configuration section remains inactive.
On the 1. Tell me about your data page, click on the Year field header to expand it.
Notice that it has automatically been categorized as a measure.
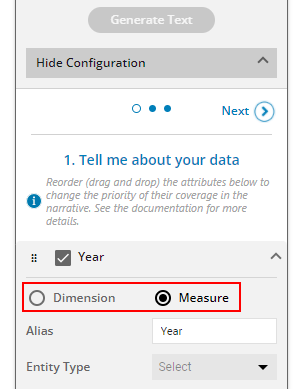
By default, the add-in automatically categorizes all fields containing numerical data as measures. However, Measure is not the appropriate category for the Year field.
Click the Dimension option to recategorize the Year field as a dimension. Further characterize the Year field as a time dimension, by selecting
DateTimein the Entity Type field.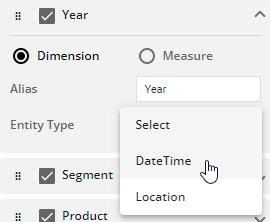
Tip
To ensure the add-in automatically categorizes Year as a dimension in future, change the cell format of this field from
NumbertoDatein the Raw data tab of the Excel workbook.Click on the Year field header to minimize it.
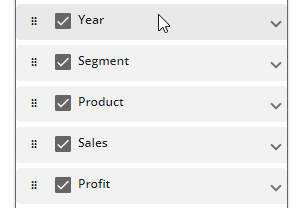
Drag the Product dimension above the Segment dimension to prioritize its order in the narrative drilldown.
Expand the Segment field.
In the Alias field, enter
Market.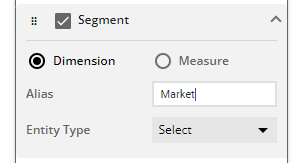
In the narrative, the Segment field will now be referred to as Market.
Minimize the Segment field.
Drag the Profit measure above the Sales measure to change their priority order.
The Descriptive Statistics narrative will now show the analysis of the Profit measure before the analysis of the Sales measure.
Click Profit to expand the field. Set the Entity Type field to
Currency, and in the Unit field enterUSD.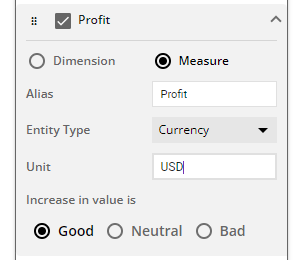
Profit figures will now be formatted as US dollars. For example, the output narrative will display
3,000,000as$3M.Note
No currency conversion calculation is performed when you set Entity Type to
Currency.Repeat step 9 for the Sales measure.
Tip
Refer to 1. Tell me about your data for more information on characterizing and prioritizing your data.
All dimensions and measures are now configured as required by the Descriptive Statistics app. Next, you'll select Descriptive Statistics from the list of available apps.
