Add Arria for Excel to a sample workbook
Note
The following procedure assumes that you have already installed the Arria for Excel add-in and downloaded the ConfigureNarrative_Excel workbook.
You'll begin by inserting Arria for Excel into the sample Excel workbook, which includes typical sales data.
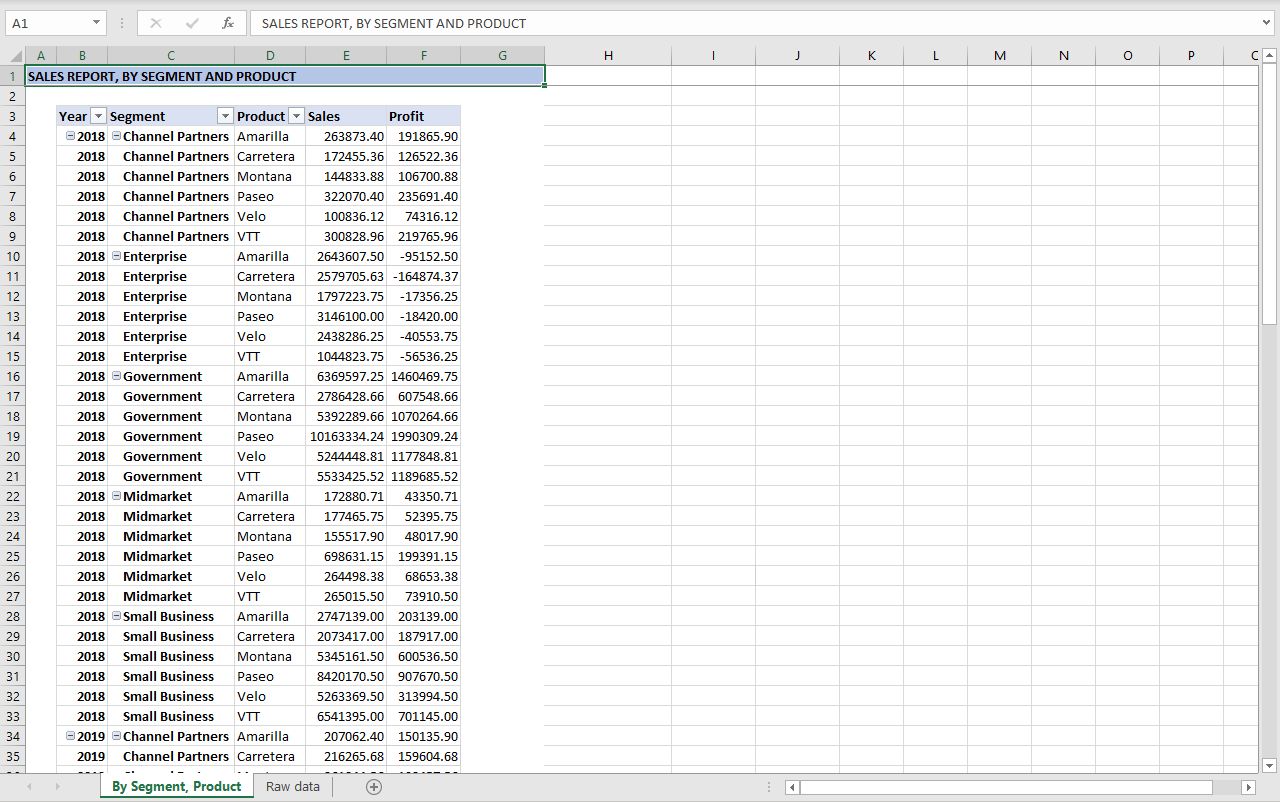
In Excel Desktop or Excel for the web, open the ConfiguringNarratives _Excel workbook.
You see a simple pivot table, containing sales data for the years 2018 and 2019.
Note
When using the Configure Narrative option and our out-of-the-box narratives, your data must be laid out in contiguous tables (no empty cells, rows, or columns).
Pivot tables laid out in tabular form (or pivot-like, raw data tables) with all item labels repeated, and with no subtotals or grand totals, are ideal. They should contain only those fields you wish to report on.
See Supported table types for more information.
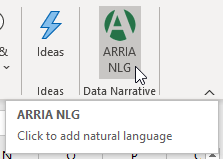
From the Home tab, in the Data Narrative group, click the ARRIA NLG button to bring the add-in into your workbook.
You now see the Arria task pane in your worksheet.
Note
You may need to sign in to your Arria account before proceeding.
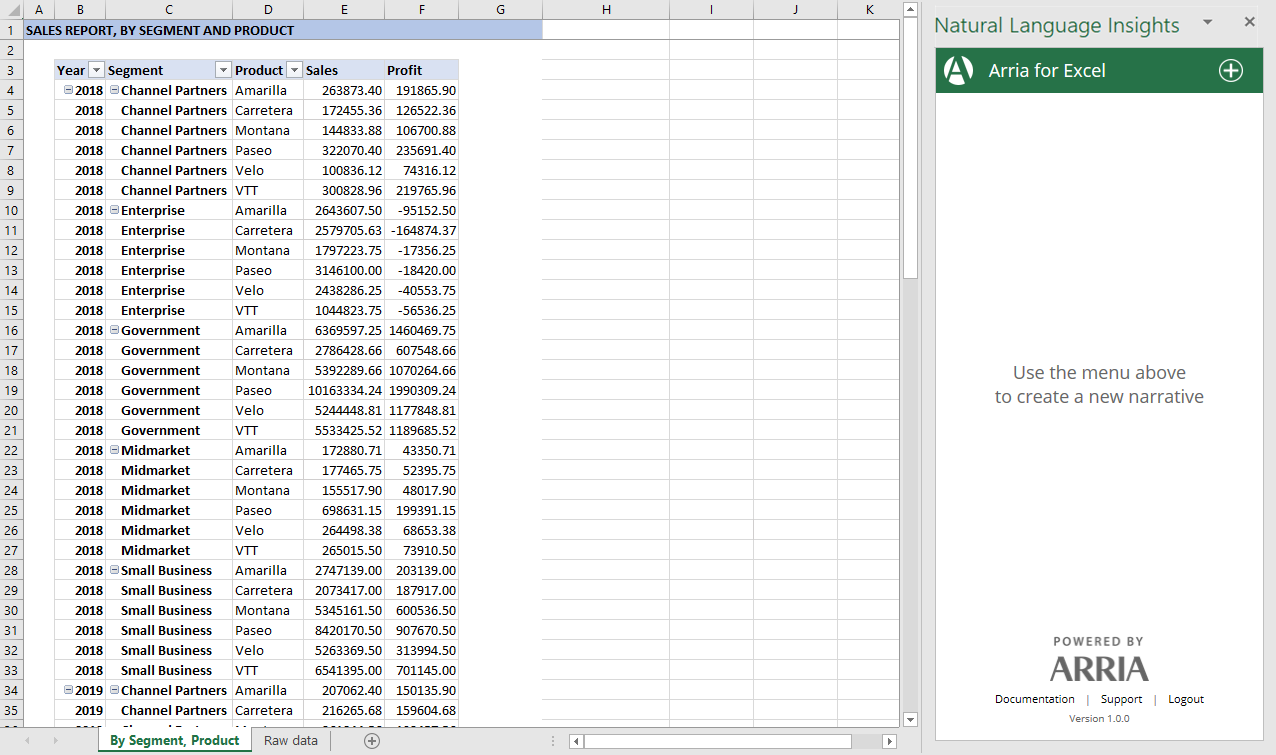
Move and resize the task pane as desired.
Next, you'll add a Configure Narrative tile to the Arria for Excel task pane and select the data to be analyzed.
