Select data and sign in to your Arria account
In this tutorial, you'll generate a narrative using the Descriptive Statistics app. Before selecting the data fields to be analyzed, you must consider the data requirements for this app.
Some data requirements — field names and formats — are the same for each NLG app. See NLG Apps reference > Data field names and formats for details.
Other data requirements — the minimum number of required fields and the supported combinations of aggregation and entity types — vary by app. You can find these details in the NLG Apps Directory.
The Descriptive Statistics app has the following requirements:
Minimum number of fields: one measure and one non-time dimension.
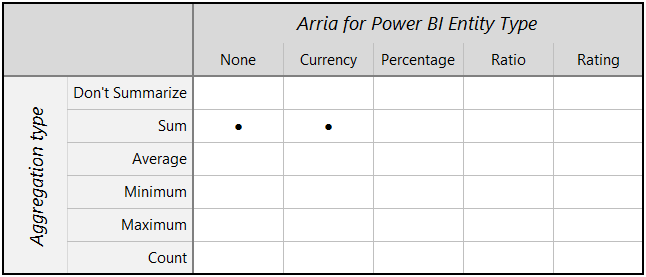
Supported combinations of aggregation and entity types:
Now you'll select three measures and three non-time dimensions for the analysis.
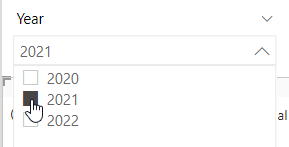
First, select only the data for 2021 using the Year filter at the top left of the report.
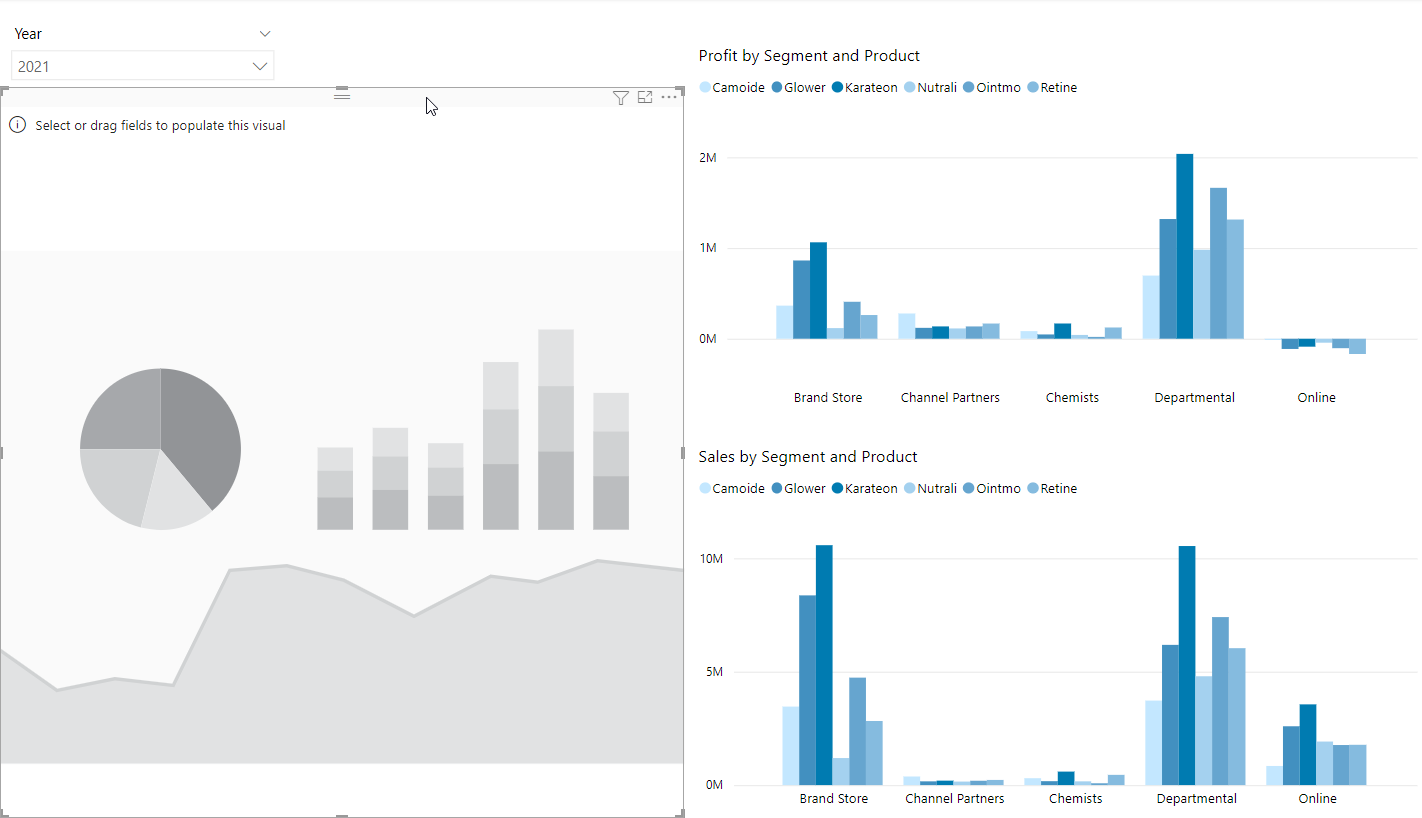
Click on the Arria visual to select it.
Important
Make sure the Arria visual is selected. If you have any other visual selected during the next step, it will be overwritten.
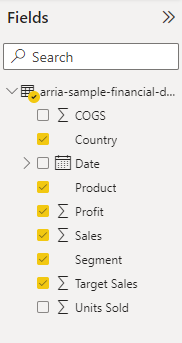
In the Fields pane, select the following fields: Country, Product, Profit, Sales, Segment, and Target Sales.
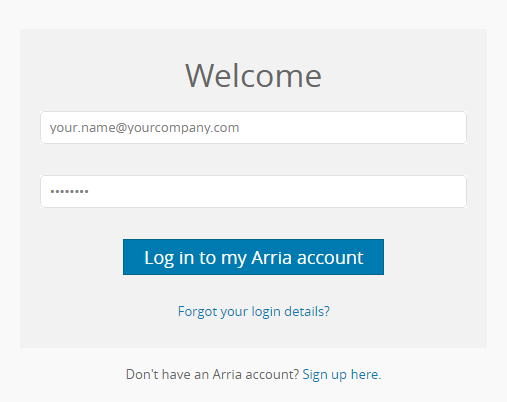
In the Arria visualization, you are presented with the Welcome page.
Enter your Arria account credentials and click Log in to my Arria account.
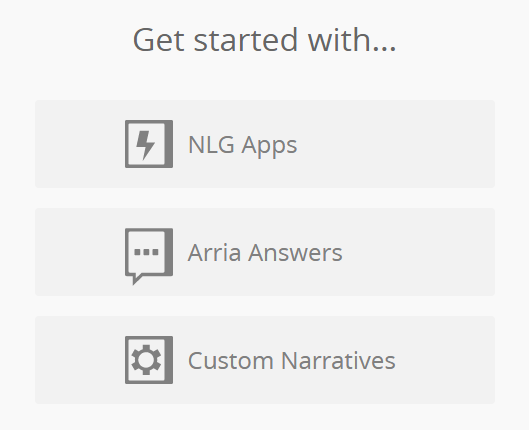
You are presented with the Get started with... page:
You've added three dimensions (Product, Country, and Segment) and three measures (Profit, Sales, and Target Sales). Next, you'll select the Descriptive Statistics app in Step 1 of the NLG Apps wizard.
Next, you'll select the Descriptive Statistics app in Step 1 of the NLG Apps wizard.