Release notes
Arria for Power BI
For further information or help with any of these issues, please contact our Support Team.
Version 3.4.17.0
April 2024
Enhancements
Security updates
This release includes essential security updates.
Version 3.4.16.0
March 2024
Enhancements
Security updates
This release includes essential security updates.
Version 3.4.15.0
January 2024
Enhancements
Security updates
This release includes essential security updates.
Version 3.4.14.0
November 2023
Enhancements
Security updates
This release includes essential security updates.
Version 3.4.13.0
October 2023
Enhancements
Security updates
This release includes essential security updates.
Version 3.4.12.0
July 2023
Enhancements
Security updates
This release includes essential security updates.
Version 3.4.11.0
Arria Answers 1.3.7
June 2023
Arria Answers 1.3.7 is now available through Arria for Power BI 3.4.11.0 and includes the change below.
Fixed issue
Field values that contain slashes are now supported
Arria Answers now correctly handles questions that reference field values containing slashes. For example:
What are my Sales in N/America?
Arria for Power BI 3.4.11.0
March 2023
Enhancements
Security updates
This release includes essential security updates.
Version 3.4.10.0
February 2023
Enhancements
Security updates
This release includes essential security updates.
Version 3.4.9.0
February 2023
Fixed issues
NLG Apps: Missing dimension instances in Time Variance narrative
The Time Variance app sometimes returned an incomplete narrative — specifically, some selected dimension instances were omitted — when the input data included composite date values.
Known issues
NLG Apps: Delays generating narratives on copied visuals
You may experience delays when you attempt to generate narratives on a visual created by copy-pasting. To avoid this, don't create a new Arria visual by copying an existing one.
Version 3.4.8.0
February 2023
Notable changes
NLG Apps: Additional license checking
We now check that the narrative creator has a valid Arria for Power BI license each time a narrative is generated in a dashboard or report.
If no valid license is found, the following error message is generated instead of a narrative:
Your license is inactive. Please contact us at support.studio@arria.com.
Note
As a result of this change, Arria for Power BI may issue the following warning when generating narratives created with an older version of the add-in:
We're having problems validating your license. Please contact us at support.studio@arria.com.
Enhancements
Security updates
This release includes essential security updates.
Version 3.4.7.0
December 2022
Note
Arria for Power BI 3.4.4.0, 3.4.5.0, and 3.4.6.0 were released internally only.
New features and enhancements
NLG Apps: Support for calculated measures
NLG Apps now supports the analysis of calculated measures, provided that aggregating those calculated measures by Sum or Average during analysis is valid and all app-specific data requirements are met.
For each NLG app, the table below shows the supported entity types for calculated measures.
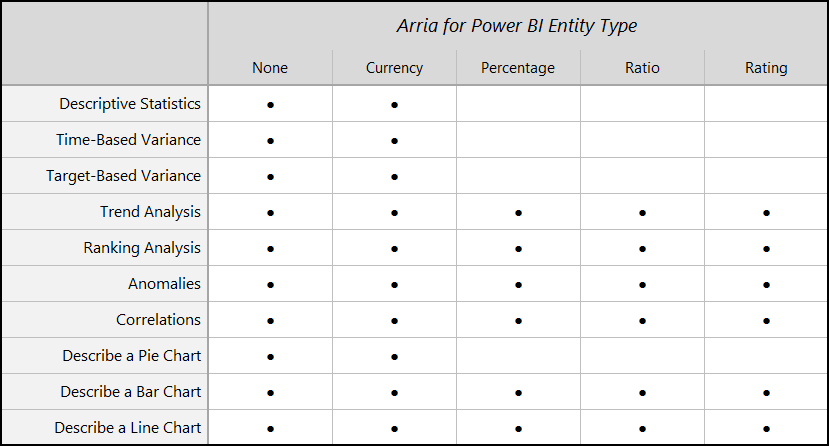
See the NLG Apps Directory for app-specific data requirements.
Security updates
This release includes essential security updates.
Version 3.4.3.0
November 2022
Fixed issues
Security updates
This release includes essential security updates.
Version 3.4.2.0
September 2022
Note
Arria for Power BI 3.4.1.0 was released internally only.
Enhancements
Security updates
This release includes essential security updates.
Fixed issues
Custom Narratives: 'Sales Data' prepended to measure names
Arria for Power BI 3.4.0.0 prepended 'Sales Data' to the name of each measure sent to the Studio project. This no longer occurs.
Zeros converted to null values
We have fixed an issue that resulted in zero values in measures being converted to nulls.
Version 3.4.0.0
Arria Answers 1.3.0
21 August 2022
Arria Answers 1.3.0 is now available through Arria for Power BI 3.4.0.0 and includes the changes described below.
New features and enhancements
New "overall" keyword
When you include "overall" in your query, Arria Answers analyzes the whole dataset, no matter how you've set the default time filter. See Querying the whole dataset for guidance.
Exclusion filters
You can now exclude non-time dimension instances from your query. For example:
"What are my Sales excluding Germany?"
"Tell me about Profit except for Retine and Glower."
See Exclusion filters for guidance.
New single-period variance queries
You can now ask how much a measure has changed over a single month, quarter, or year. For example:
"How did my Sales change in June 2022?"
See Single-period variance for guidance.
Changes to group-by queries
Group-by queries now work with four aggregation types: sum, average, maximum, and minimum.
Group-by queries with sum aggregation (e.g. What are my Sales by Country?) now return a list of aggregated totals in descending order.
You can now ask if the group-by values are similar or identical, or if there are outliers. You can also ask for a specific number of values — for example, the top three only. See Group-by queries for guidance.
Fixed issues
Handling of null values
Measures
Null values in measures can affect the accuracy of calculations. Arria Answers now warns you when you query a measure that has one or more null values. For example:
"In 2019, Sales were $43,580. Please note, your Sales column has some missing data."
Dimensions
Null values in non-time dimensions (e.g. Country) are valid. Previously, Arria Answers returned an error when you queried a dimension that had one or more null values. Now, the null-value rows are removed from the analysis and a valid answer is returned.
Time dimensions
Previously, Arria Answers generated an error when you queried a time dimension that had one or more null values. Now, the null-value rows are removed from the analysis and the answer includes a sentence alerting you to this. For example:
"In February 2022, Sales were $5.03 million. I found some incorrectly formatted temporal data and removed those rows from my calculations."
Querying a time period with missing data
Assume that your dataset has data for February and March but none for January. If you ask How are my Sales between January and March?, the answer now includes a sentence alerting you to the missing data. For example:
"Between January 2022 and March 2022, Sales were $5.72 million. Not all months within the time period had data."
Known issues
Arria Answers may return multiple values for each dimension instance
An average group-by query finds the average value for each instance of the dimension and returns a list of values. This works if you have selected one dimension (e.g. Country) for use with Arria Answers. If you have selected multiple dimensions (e.g. Country and Product), you may get multiple average values for each instance.
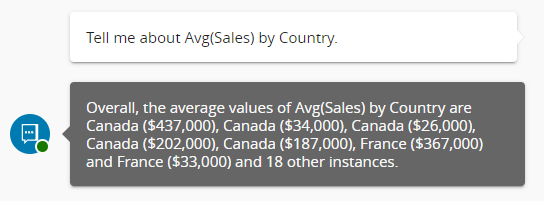
In the example above, the answer doesn’t return a single value for each country. You get multiple values for Canada (one for each product), multiple values for France (one for each product), and so on. To avoid this, deselect every dimension other than the one you wish to group by.
See Group-by queries for more information.
Day values are not working in cardinal form
A time-point filter should work whether the day value is a cardinal number (e.g. 1 July 2022) or an ordinal number (e.g. 1st July 2022). Due to a bug, Arria Answers currently returns incorrect answers if you use cardinal numbers. Please use the ordinal form.
Confusing answers for group-by queries with max/min aggregation
If your group-by query requests a specific number of top or bottom entries and the measure contains some identical max/min values, the number of entries returned may not match the number requested. For example:
Query: "What are the top two for Max(Sales) by Country?"
Answer: "Overall, the maximum 2 entries for Max(Sales) by Country are France ($20,000), Italy ($20,000) and Germany ($20,000)."
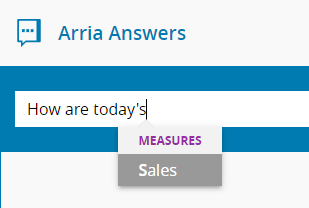
Apostrophes in queries may trigger the autocomplete list
Typing a letter immediately after an apostrophe (e.g. the s in today's) may open the autocomplete list in error. Immediately selecting from the list (e.g. Sales) produces an invalid query. To avoid this, enter a space and continue typing your query.
Arria for Power BI 3.4.0.0
14 July 2022
New features and enhancements
Redesigned user interface
Arria for Power BI 3.4.0.0 introduces a redesigned user interface — making it even easier to add automatically generated natural-language insights to your reports.
Learn Arria for Power BI basics and find out more from the NLG Apps, Arria Answers, and Custom Narratives documentation.
NLG Apps optimizations
Arria for Power BI 3.4.0.0 introduces several optimizations to the Describe a Bar Chart, Time-Based Variance, Target-Based Variance, and Trend Analysis apps. You now have more control over narrative length, content, and formatting, resulting in narratives that are optimized for your specific reporting requirements and improved readability.
See NLG Apps optimizations for details.
Notable changes
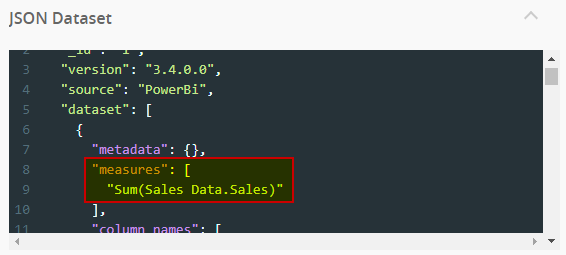
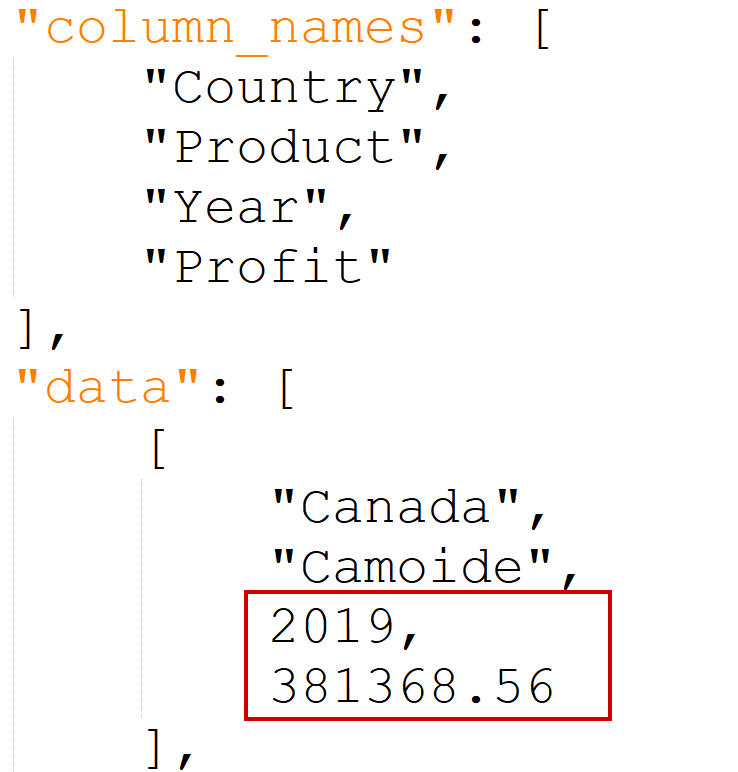
Custom Narratives: Numerical values in JSON data
In previous versions of the Arria visual, numerical values were passed to Studio as numbers in the JSON data. Arria for Power BI 3.4.0.0 passes numerical values as strings.
Previous versions of Arria for Power BI
Arria for Power BI 3.4.0.0
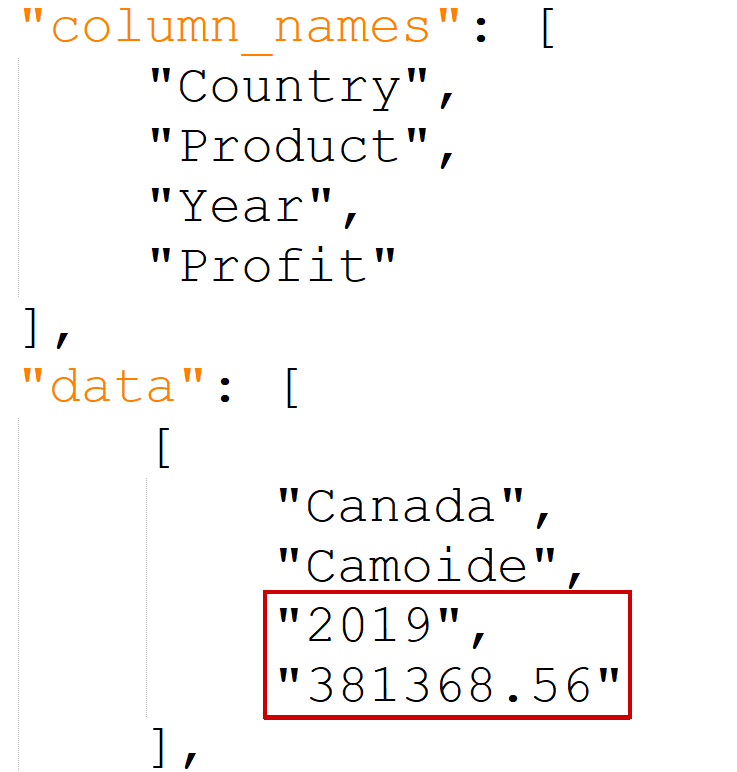
You may need to update existing JSON-type Studio projects to accommodate this change. Please contact us if you have questions or need help updating your projects.
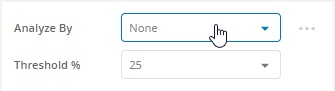
Custom Narratives: None value for Parameter Controls
In the updated visual, the default value for Parameter Controls is None. If your Custom Narratives Studio project uses parameter controls, you must configure that project to handle the None value, which is passed as an empty string (" ").
Known issues
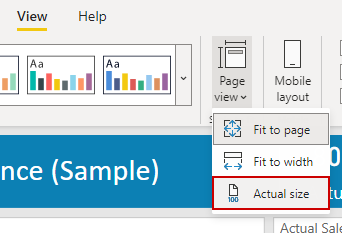
Arria for Power BI visual may appear blurred in Fit to page and Fit to width view
Arria's custom visual may appear blurred when using Power BI in the Fit to page or Fit to width view. To work around this issue, use the Actual size page view.
NLG Apps: Time-Based Variance, Target Analysis, and Describe a Bar Chart apps do not support the Don't summarize option
The Target-Based Variance, Trend Analysis, and Describe a Bar Chart apps don't support the Don't summarize aggregation type. For guidance on supported combinations of aggregation and entity types, see the NLG Apps Directory.
NLG Apps and Arria Answers: Changing a measure's aggregation type resets the Entity Type field
Changing the aggregation type of a measure that has already been added to the Arria visual resets that measure's Entity Type field to
None. This can lead to unexpected errors and narratives.To work around this issue, reconfigure the Entity Type field after changing a measure's aggregation type.
NLG Apps: Currency values rounding error
At the data analysis level, NLG apps work with the actual values in your data. At the narrative level, however, the apps display large currency values in rounded form. This is done to improve readability, but occasionally it creates the false appearance of a calculation error.
For example, if the March Sales value is $2,666,503 and the April Sales value is $4,821,627.50, an NLG app correctly calculates (from the raw data) a variance value of $2,155,124.50. If your Sales measure has its Entity Type set to
Currency, the app might report this insight as:"Sales rose by $2.16M from $2.67M to $4.82M between Mar 2022 and Apr 2022."
This statement appears inaccurate because the difference between $2.67M and $4.82M is $2.15M, not $2.16M. The app has calculated correctly; the reported result appears inaccurate only because rounding was applied to all three currency values for display purposes AFTER data analysis was complete.
NLG Apps and Custom Narratives: Custom font color is not retained when copying and pasting
When you copy using the Copy Narratives feature, the color markup applied by the Font Color setting is not retained; when you paste into applications such as Word, the text color is always black.
To retain the color markup, manually select and copy (e.g. Ctrl+C) the text instead.
Version 3.3.1.0
March 2022
New features and enhancements
Arria Answers: Support for single date fields
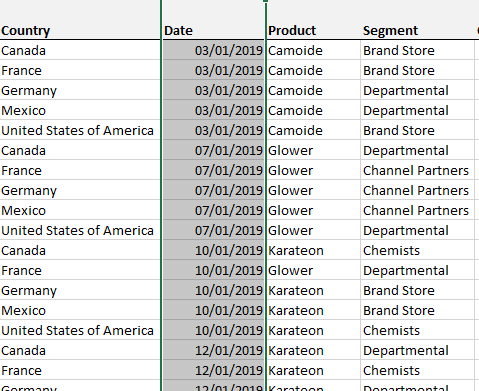
Arria Answers can now handle date values stored in a single column, as shown below. Spreading date components (year, quarter, month, and day) across multiple columns is no longer required.
Arria Answers: Two-digit year values
In addition to four-digit year values (e.g. 2022), two-digit year values (e.g. 22) are now supported.
Arria Answers: Support for additional aggregation types
Arria Answers now supports five aggregation types: Don't summarize, Sum, Average, Minimum, and Maximum. Previously, it supported Don't summarize and Sum aggregation only. This improvement increases your options for querying your data — see Query types for guidance.
Fixed issues
NLG Apps: Changing the aggregation type of a measure to an unsupported type resulted in errors or incorrect narratives
Previously, when Arria for Power BI displayed a generated narrative, changing a measure's aggregation type to one unsupported by the app resulted in errors or incorrect narratives. This no longer occurs.
Arria Answers now correctly handles values that contain asterisks
Arria Answers no longer generates an error message when a data field's name contains an asterisk.
Known issues
NLG Apps: Some narratives must be reconfigured after updating to Arria for Power BI 3.3.1.0
When you update to Arria for Power BI 3.3.1.0, the add-in replaces any pre-existing narratives generated using the Anomalies, Correlations, Describe a Pie Chart, Describe a Bar Chart, and Describe a Line Chart apps. More specifically, the update replaces the narrative with an error message or a narrative generated by a different NLG app.
To resolve this issue, you must reconfigure any narratives generated using these apps after completing the update.
Arria Answers: Hyphens are not supported in field names or values
Arria Answers does not recognize field names or field values containing hyphens.
Arria Answers: Empty cells (null values) in dimension fields result in error messages
If a non-time dimension field in your dataset — e.g. Country or Product — contains empty cells (null values), Arria Answers returns this error message:
I'm sorry, something went wrong. Please try again or ask for help.
If a time dimension field in your dataset — e.g. Date or Year — contains empty cells (null values), Arria Answers returns this error message:
I'm sorry, I can't understand your date column format. Please use an ISO-8601 format and try again.
To avoid these issues, please ensure that your dimension fields contain no empty cells.
Version 3.3.0
December 2021
New features and enhancements
New NLG Apps
Arria for Power BI 3.3.0 introduces two new out-of-the-box narrative types:
The Anomalies app generates a narrative that detects and contextualizes anomalies in one or more measures — at a single time point or across a time range — broken down by a number of dimensions. For example, the narrative may report unexpectedly high or low sales for a certain month when compared to all other months in the dataset.
See Anomalies for details.
The Correlations app generates an analysis of correlations between measures — at a single time point or across a time range — broken down by a number of dimensions. For example, for a particular product, the narrative may report a strong positive correlation between marketing spend and an increase in profit two months later.
See Correlations for details.
Version 3.2.2
August 2021
Fixed issues
NLG Apps: Error when existing narratives updated to version 3.2.0 of Arria for Power BI
When existing NLG Apps narratives are updated to version 3.2.0 of Arria for Power BI, the following error may occur:
Please check the data you have provided. Missing time dimension. You have not supplied the measure selected for analysis as part of the dataset.
This has been fixed in Arria for Power BI 3.2.2.
Version 3.2.1
August 2021
Fixed issues
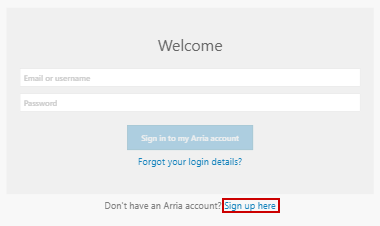
Incorrect sign-up URL on Welcome page
The Sign up here URL has been updated.
Version 3.2.0
August 2021
New features and enhancements
NLG Apps: Support for additional aggregation and entity types
Arria for Power BI 3.2 introduces NLG Apps support for measures aggregated by Average, Minimum, Maximum, and Count, and precalculated values such as percentages, ratings, and ratios.
See the Aggregation and entity types topic for further information.
Important
Arria Answers currently supports only the Sum aggregation type and the None and Currency entity types. When switching from an NLG Apps narrative to Arria Answers, make sure the measures chosen to generate the narrative meet these requirements. If they don't, Arria Answers will return incorrect responses.
Fixed issues
Using summarization with measures
When working with NLG Apps and Arria Answers in previous releases of Arria for Power BI, measures could only be aggregated using the Sum summarization type. Using other summarization types would result in erroneous narratives.
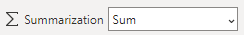
For NLG Apps only, support has been added for the Average, Minimum, Maximum, and Count summarization types. Arria Answers still supports only the Sum summarization type.
See the Aggregation and entity types topic for further information.
Known issues
NLG Apps: Changing the aggregation type of a measure to an unsupported type results in errors or incorrect narratives
When on a generated narrative page, changing the aggregation type of a measure to one that is not supported by that app results in errors or incorrect narratives being generated.
To resolve the issue, change the aggregation type back to one that is supported.
For details of the aggregation and entity type combinations supported by your chosen app, see the relevant page in the NLG Apps Directory.
Version 3.1.0
March 2021
The following enhancements to NLG Apps are now available through Arria for Power BI 3.1.0.
Support for single column dates
NLG Apps no longer requires dates to be presented as a date hierarchy in separate Year, Quarter, Month and Day fields. Single Date fields are now supported.
See Data field names and formats for more information on supported date formats.
Support for custom date field names
NLG Apps no longer requires date fields to be named exactly Date, Year, Quarter, Month, and Day.
Now, for example, fields containing day values can be named either d, D, or any expression that contains the word "day", such as day_name. This requirement is case-insensitive: any mixture of cases is acceptable. Therefore, DAY_name and Day_Name (to give two alternatives) are valid alternatives to day_name.
See Data field names and formats for more information on supported date field names.
December 2020
New features and enhancements
Two new NLG Apps narratives
The NLG Apps feature introduces two new out-of-the-box narrative types:
 Trend Analysis
Generates a narrative that analyzes the changes in trend of a measure over time. The narrative highlights significant shifts, and drills down through multiple dimensions. For example, an analysis of the changes in Sales by Month, broken down by Country, Product and Market.
 Ranking Analysis
Generates an analysis of changes in the ranking of dimensions over time as they relate to a measure, and summarizes the top and/or bottom rankings of combinations of dimensions over the same time period. For example, an analysis of the changes in Profit over a Quarter, broken down by Country, Product and Segment.
See the NLG Apps reference for details.
Notable changes
Improvements to the Describe a Line Chart NLG App narrative
The structure of the Describe a Line Chart narrative has been improved so that the data insights are presented more concisely and clearly. For example, the Correlations section has been moved to the end of the narrative and is included only when multiple measures are selected.
Fixed issues
Arria Answers: calculated measures cannot be queried
In previous versions of Arria for Power BI, Arria Answers incorrectly treated calculated measures as dimensions. This issue has been fixed.
Arria Answers: renamed data columns not recognized
In previous versions of Arria for Power BI, Arria Answers incorrectly handled columns that had been renamed in the Fields pane and issued an error stating that the renamed column could not be found. This has been fixed.
Known issues
Measures narrated in reverse order of priority when using the Descriptive Statistics app
When the Ranking option of the Descriptive Statistics app is set to
Use order of dimensions set in Step 1, the order of the measures set in Step 1 of the wizard is reversed in the generated narrative.
Arria Answers generates error when a data value contains an asterisk
Arria Answers generates the error "I'm sorry, something went wrong. Please try again or ask for help." when asked about data fields that include values containing the asterisk character.
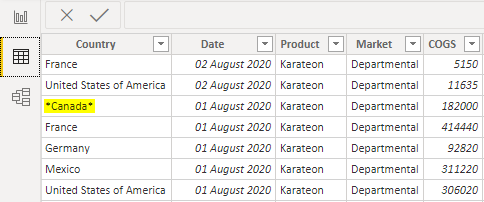
For example, the error is generated when asking about the Country data field, shown above, which includes the value
*Canada*: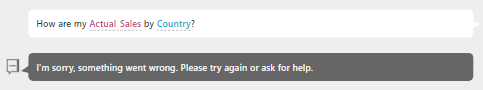
Version 3.0.2
October 2020
New features and enhancements
Support for the Power BI context menu
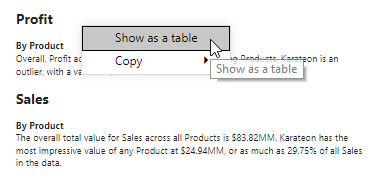
Arria for Power BI now supports the Power BI context menu feature. The Power BI context menu is accessed by right-clicking in the add-in.
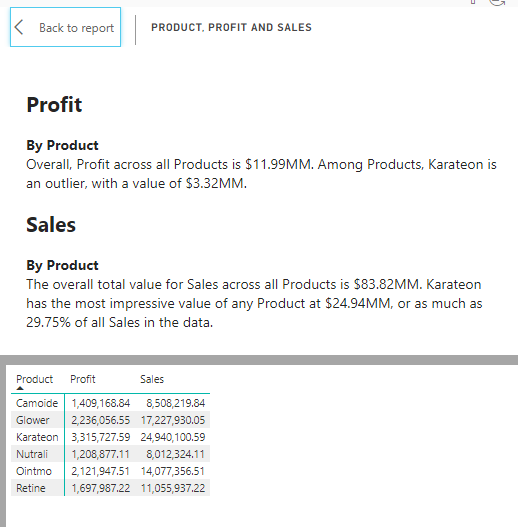
Users can now copy the visual using the Copy visual option and show the data being used to create the narrative using the Show as a table option.
Known issues
Using NLG Apps with the Private Cloud and Customer-Hosted deployment options
You may notice minor differences between the narratives generated using NLG Apps when working in a private cloud or customer-hosted environment and those generated when working in the public cloud environment.
This will be fixed in version 3.1.0.
Version 3.0.0
September 2020
Arria for Power BI 3.0.0 introduces several user interface enhancements and an all-new natural language query experience.
New features and enhancements
NLG Apps
NLG Apps (built from a feature that was formerly known as Configure Narrative) introduces three new, out-of-the-box narrative types. In addition to the existing Descriptive Statistics, Time-based Variance, and Target-based Variance analyses, you can now analyze and narrate your charts using the Describe a Pie Chart, Describe a Bar Chart, and Describe a Line Chart apps.
See NLG Apps for details.
Note
The Descriptive Statistics analysis now forms a discrete app, so this type of analysis can no longer be selected with Time-based or Target-based Variance to produce a single narrative. Instead, each analysis type and its corresponding narrative must be added to the dashboard separately.
Arria Answers
Arria Answers is a new, conversational-AI platform that integrates with Power BI dashboards to give businesses real-time access to key insights from data, using natural language queries.
See Arria Answers for details.
Support for larger datasets (payloads)
Previous versions of Arria for Power BI had a dataset limit of 30,000 rows. Improvements to the add-in mean that there is no longer a limit on the number of rows in your data.
Now, the only restriction on dataset size is the data payload limit imposed by Studio (20MB).
See Dataset size limits and performance for details.
Notable changes
New Arria for Power BI login
To configure Arria for Power BI, you are now required to log in to the add-in using your Arria NLG Studio or Arria for Power BI account credentials.
The new Arria for Power BI account's subscription model allows you to choose the core features (NLG Apps, Arria Answers, and Custom Narratives) you want to configure and make available to your dashboard viewers.
See Arria accounts and supported features for details.
Private Cloud and Customer-Hosted deployment options
Users of the Private Cloud (a.k.a. Dedicated Cloud) and Customer-Hosted (a.k.a. On-Premises) deployment options can no longer use the publicly available Arria for Power BI add-in.
Instead, a unique instance of the add-in, configured to call your exclusive Arria for Power BI services, must be downloaded from your private cloud or customer-hosted environment.
Contact your systems administrator for details.
Fixed issues
Comma-separated values now correctly handled when working with table-type custom narrative projects.
Comma-separated values in a single cell are now correctly handled when calling table-type Studio projects from the add-in.
Known issues
Supported browsers
Arria for Power BI 3.0.0 is supported in the Chrome and Edge browsers only.
Using summarization with measures
When working with NLG Apps and Arria Answers, measures can only be aggregated using the Sum summarization type. Using other summarization types will result in erroneous narratives.
When working with Custom Narratives, you may use any summarization type as long as the custom Studio project has been configured to handle it.
Arria Answers: calculated measures cannot be queried
Arria Answers incorrectly treats calculated measures as dimensions. You may receive errors such as "I'm sorry, I can't answer a question without a measure".
Arria Answers: renamed data columns not recognized
Arria Answers does not recognize columns that have been renamed in the Fields pane.
Although they are correctly identified as a dimension or measure in the question entered into Arria Answers (highlighted in pink or orange), you will receive an error stating that the column could not be found.
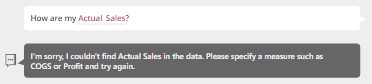
For example, renaming the Sales column as Actual Sales in the Fields pane results in this error: