Showcase Report
A sales performance analysis, created using Arria for Power BI
Overview
Download our showcase report to experience Arria for Power BI in action.
See how our intelligent narratives augment the report with automatically-generated, insightful summaries that interpret the visuals and uncover the story behind them. Understand how Arria's narratives enable you to make faster, data-driven decisions and accelerate informed action.
Experience the full interactivity of Arria's narratives: see them automatically regenerate in response to actions you take within the dashboard, such as filtering charts, clicking on bookmarks, or using the add-in's Parameter Controls feature.
Switch to Arria Answers from any of the narratives to gain real-time insights by asking specific questions of your data in natural language.
Highlights
Each page of the showcase report, which contains typical sales data, demonstrates one of Arria for Power BI's core features.
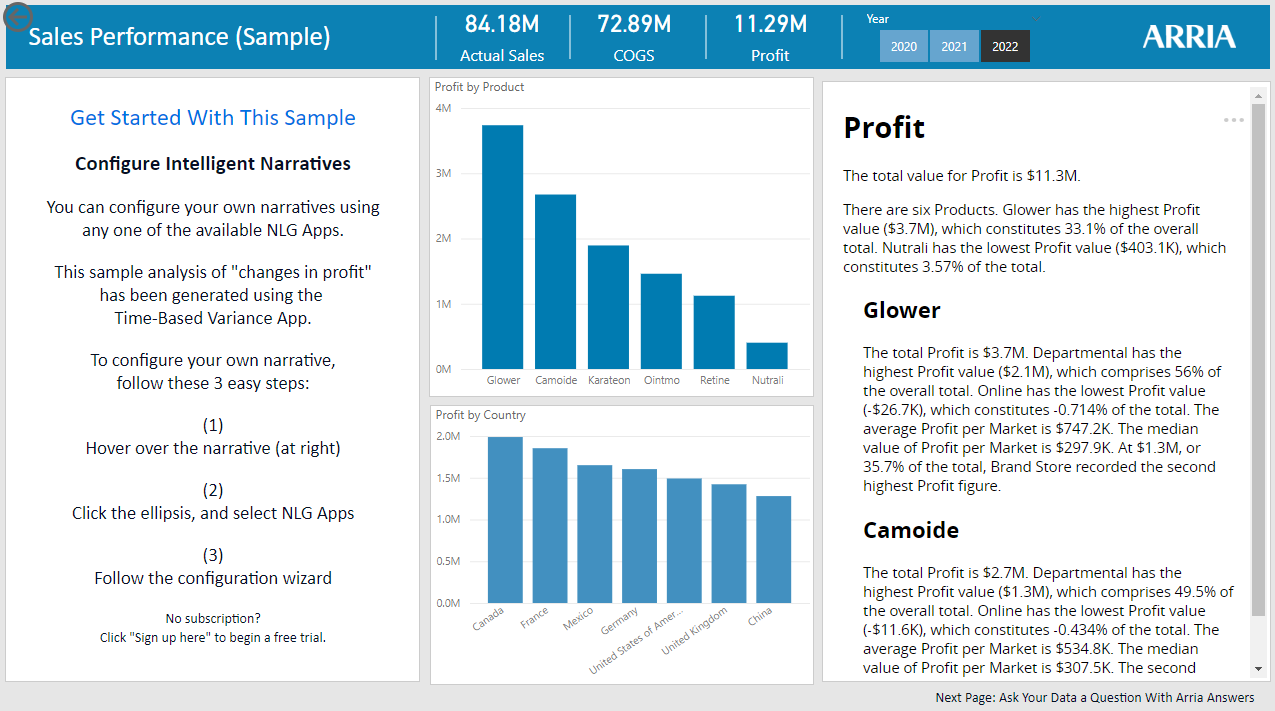
1 Explore Intelligent Narratives
Intelligent Narratives add instant understanding to any Power BI dashboard — no coding required. In this report, each of our ready-to-use NLG Apps has been configured in three simple steps and the corresponding intelligent narrative added to the report with the click of a button.
Click the visuals on the Analyze Sales Performance, Analyze Trends/Ranking, Analyze Anomalies/Correlations, and Describe Charts pages to watch the narratives update instantly, then try configuring an NLG App on the Configure Intelligent Narratives page.
Analyze Sales Performance
The Analyze Sales Performance page showcases the analysis of sales performance in terms of quantitative insights like totals, minimums, maximums and outliers, and in terms of variance over time or variance between target and actual values.
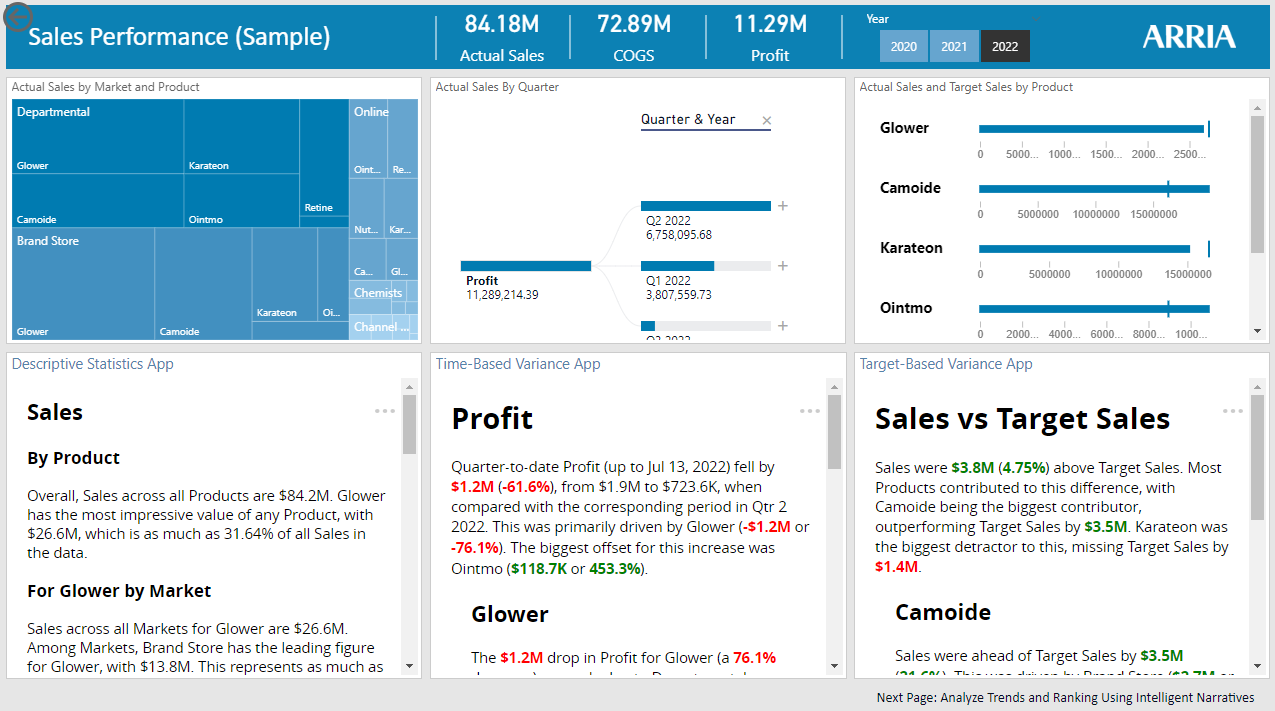 | ||||
Generates a summary of quantitative insights derived from your measures and dimensions, describing where statistically interesting breakdowns appear. | Analyzes the variance in performance of a measure between two time periods, such as current quarter vs. the same quarter of the previous year. | Analyzes the variance between the target value and the actual value of a measure, drilling down through multiple dimensions to build the narrative. | ||


Analyze Trends/Ranking
The Analyze Trends/Ranking page showcases our latest ready-to-use intelligent narratives. These NLG Apps analyze measures over time in terms of trends and the ranking of dimensions such as Market, Product and Country.
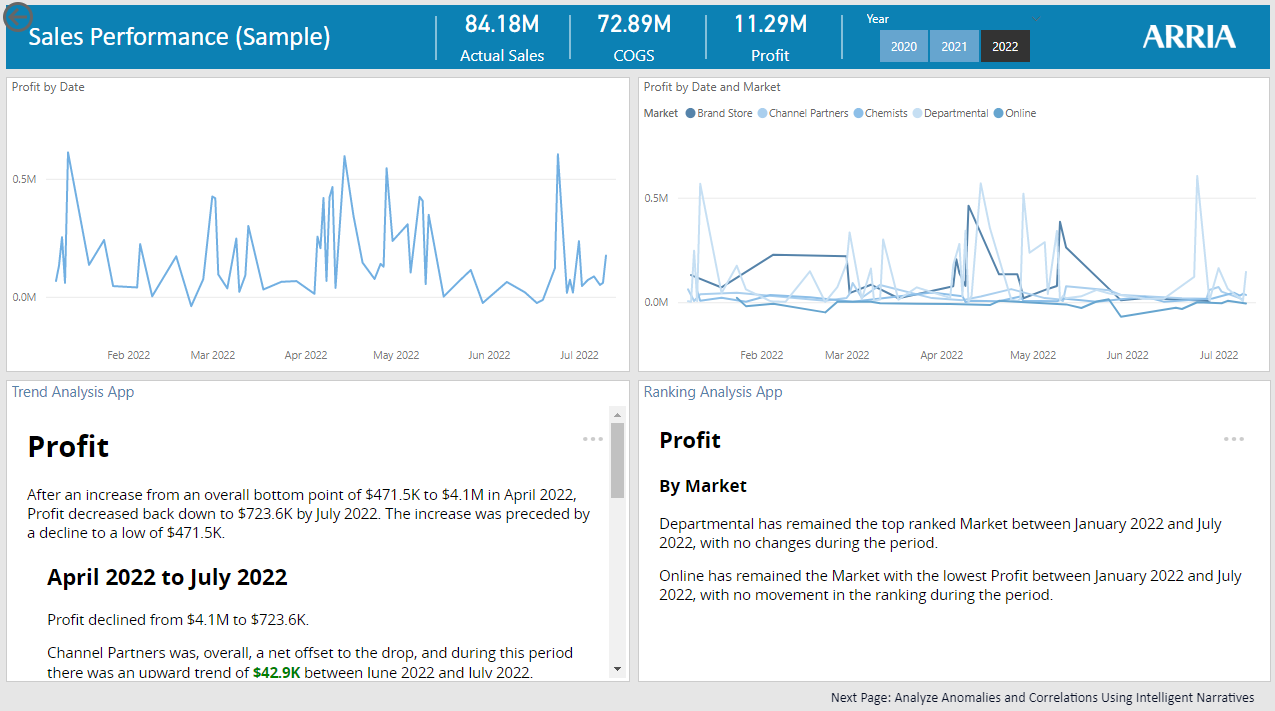 | |||
Analyzes the changes in a measure over time, highlighting significant trends and drilling down through a number of dimensions to build the narrative. | Summarizes the top and bottom rankings of combinations of dimensions over time, highlighting changes in rank. | ||


Analyze Anomalies/Correlations
The Analyze Anomalies/Correlations page showcases our latest ready-to-use intelligent narratives, which help you understand the anomalies and correlations in your data.
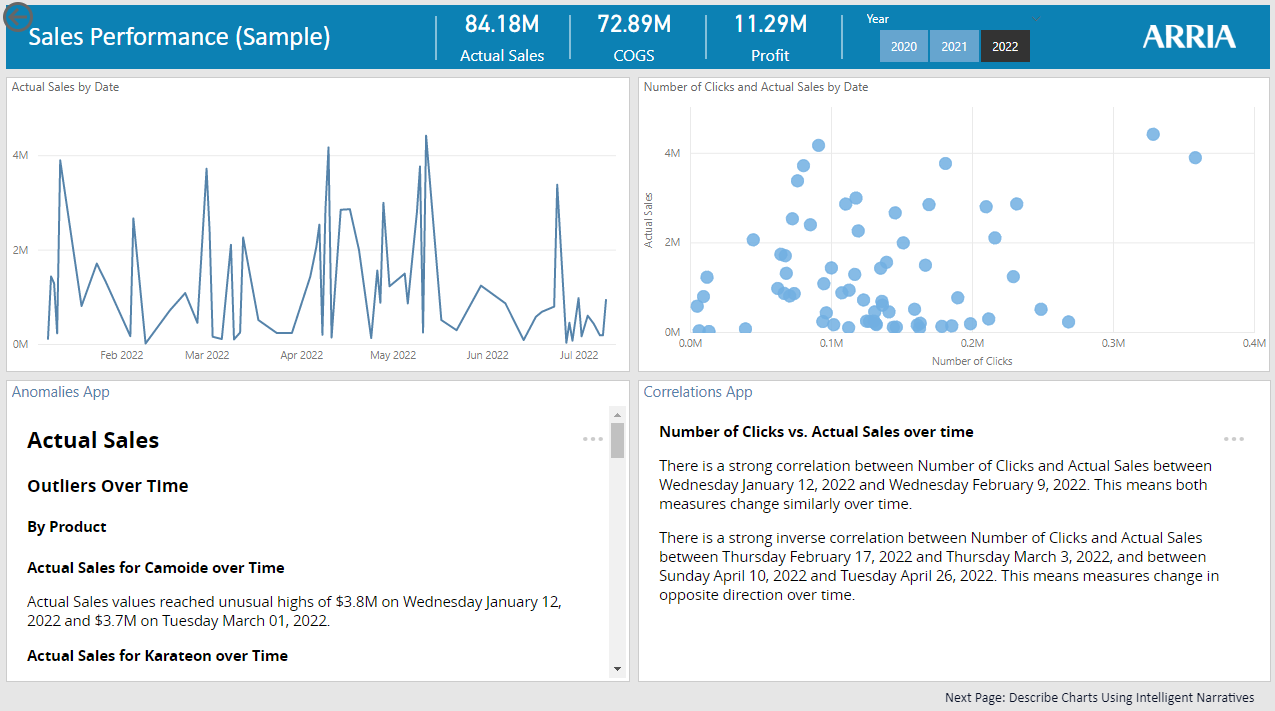 | |||
Detects, highlights, and contextualizes anomalies in a dataset, drilling down through multiple dimensions to build the narrative. | Detects and highlights correlations between series of data points, drilling down through multiple dimensions to build the narrative. | ||


Describe Charts
The Describe Charts page showcases three narrative apps that interpret and bring more meaning to pie, bar, and line charts.
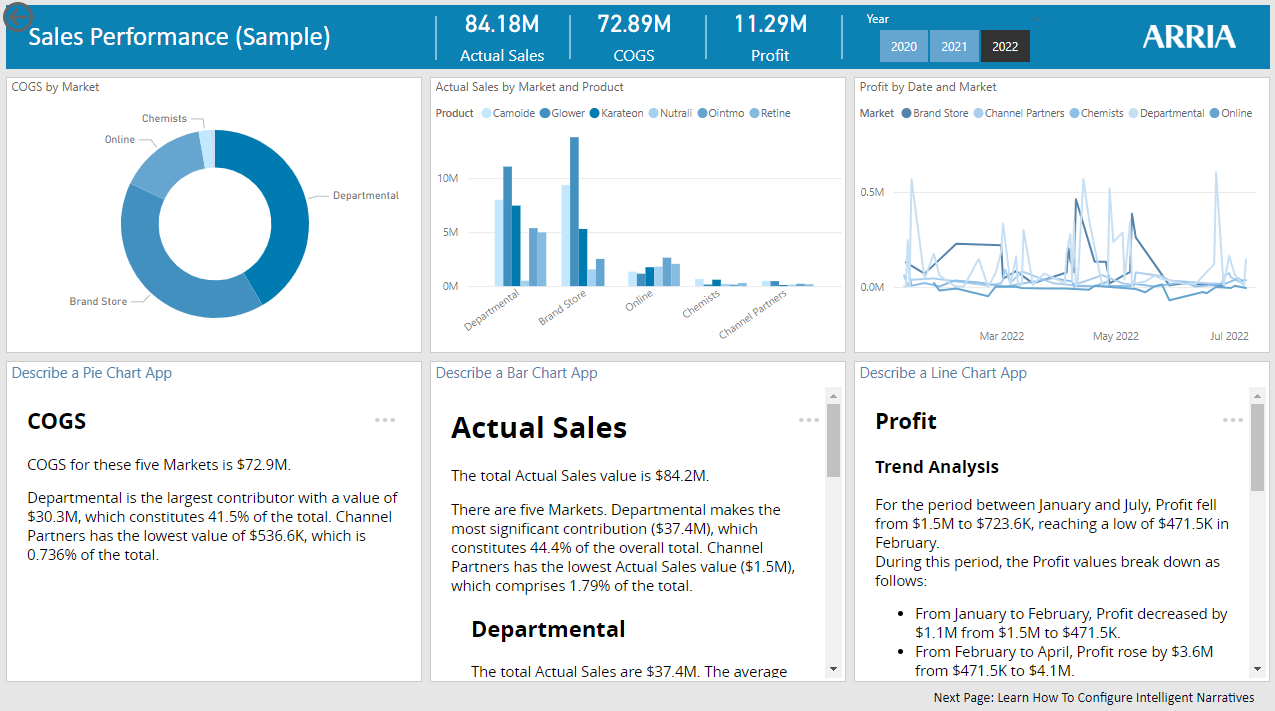 | ||||
Describes a pie chart and highlights statistically relevant insights from the underlying data to explain the chart in more detail. | Describes a bar chart and highlights statistically relevant insights from the underlying data to explain the chart in more detail. | Describes a line chart and highlights statistically relevant insights from the underlying data to explain the chart in more detail. | ||


Configure Intelligent Narratives
You can configure any one of the available NLG Apps to create your own narratives. Follow the three easy steps outlined on this page to try it out and learn more from the NLG Apps reference.
 |
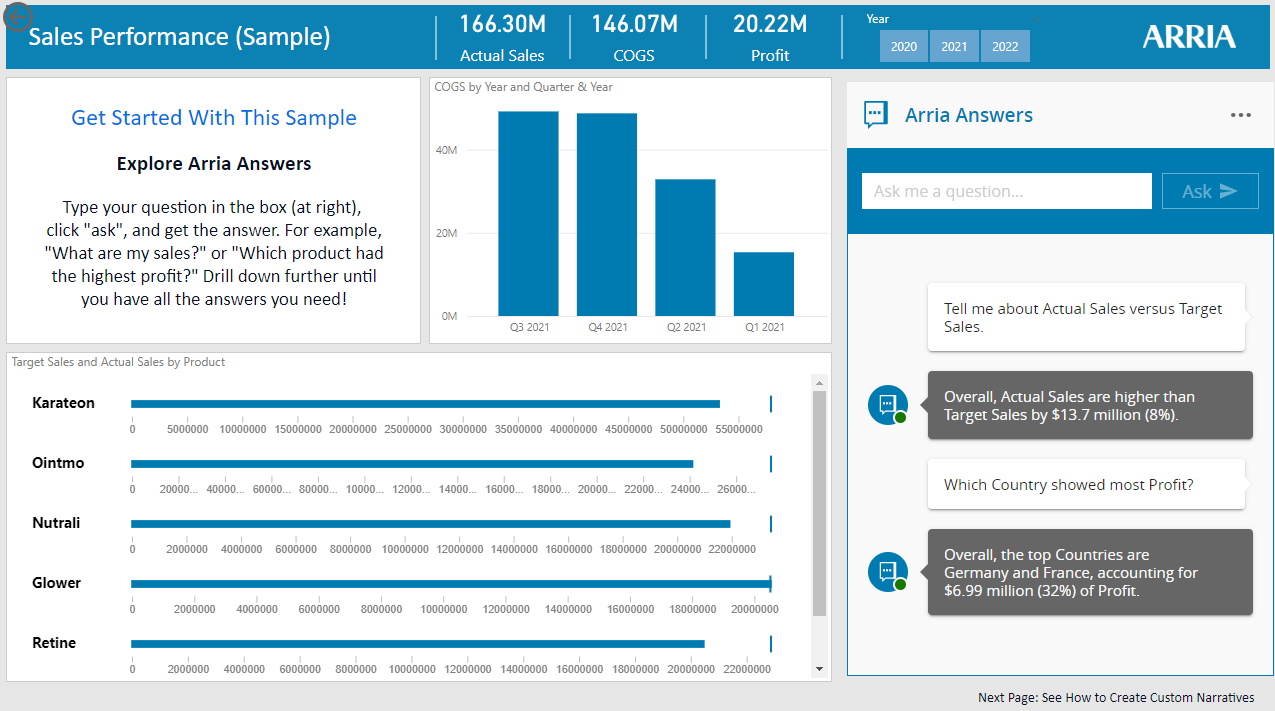
2 Explore Arria Answers
Arria Answers for Power BI is a conversational-AI platform that gives you real-time access to key insights from your data, using natural language. Move between visuals and Arria Answers whenever a question comes to mind — without interrupting your workflow.
Drill down into your data by asking questions like Which Country showed most Profit? and Tell me about Actual Sales versus Target Sales?
 |
See the Arria Answers reference to learn about supported query types.
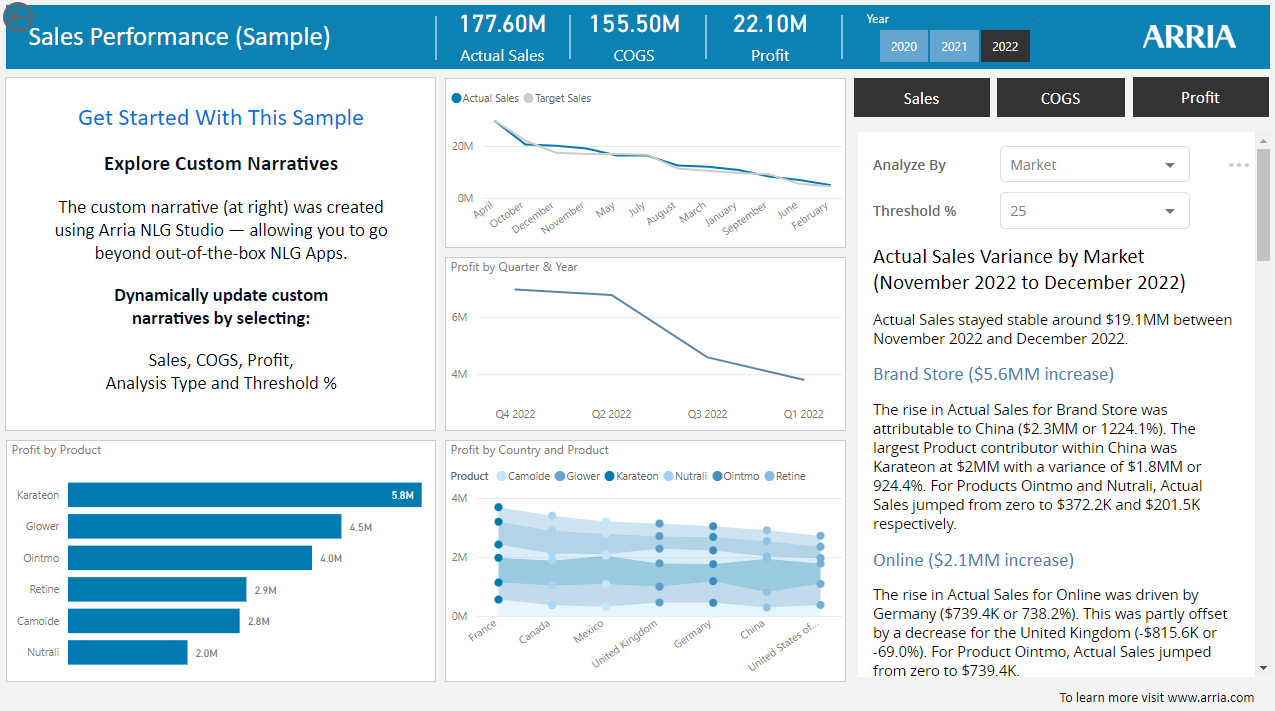
3 Explore Custom Narratives
Created using Arria NLG Studio and configured using Arria for Power BI's Custom Narratives feature, the narrative on this page complements the visuals with a month-on-month sales variance analysis, identifying key insights, and the main drivers and offsets.
This page of the report demonstrates how you can give more control to your dashboard viewers and how you can save precious real estate on your dashboard using the add-in with Power BI bookmarks.
 |
Arria for Power BI Parameter Controls
Parameter ControlsUsing the Parameter Controls feature, dashboard viewers can dynamically vary the narrative according to the values they select. | BookmarksPower BI Bookmarks let you save views and settings in your reports. The Arria for Power BI add-in applies this feature to allow users to build multi-narrative reports. |
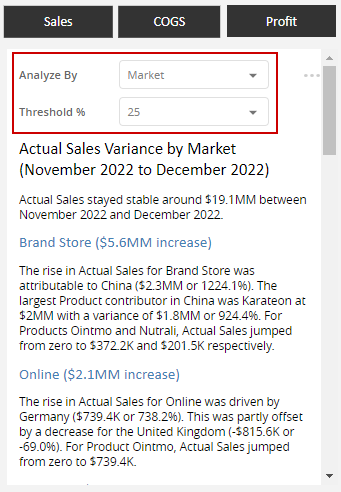 |  |
In our showcase report, the following parameters are available:
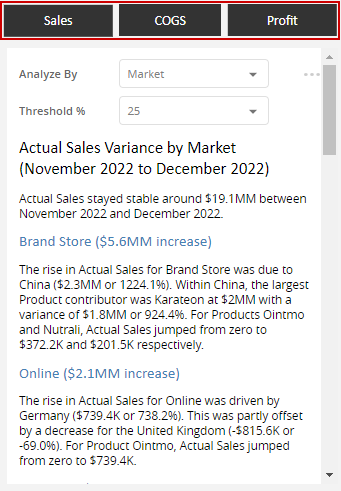
| Harness Arria's power to aggregate and narrate your entire dataset by embedding multiple narratives in your reports without reducing the space available for your visuals. At the top of the Arria visual, use the Sales, COGS, and Profit buttons to switch between these narratives. |
Questions?
We're here to help. If you have any questions about the Arria for Power BI custom visual or our showcase, please contact us.
