Select an NLG app
You should start this tutorial on the Get started with... page of the extension. All three features — NLG Apps, Arria Answers, and Custom Narratives — should be enabled.
Tip
To arrive at the starting point for this tutorial, complete the short Getting Started tutorial for Arria for Tableau.
In this tutorial, you'll generate a narrative using the Descriptive Statistics app. Before configuring the data fields to be analyzed, you must consider the data requirements of this app.
Some data requirements — supported formats and field names — are the same for each NLG app. See NLG Apps reference > Data field names and formats for details.
Other data requirements — the minimum number of required fields and the supported combinations of aggregation and entity types — vary by app. You can find these details in the NLG Apps directory.
The Descriptive Statistics app has the following requirements:
Minimum number of fields: one measure and one non-time dimension.
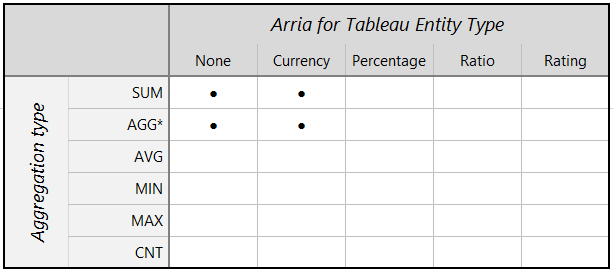
Supported combinations of aggregation and entity types:
Tip
For optimum performance in your published dashboard, it's best practice to create a worksheet view containing only the data fields that are necessary for the analysis you wish to perform. The Descriptive Statistics worksheet was created for this purpose.
The data in the Descriptive Statistics worksheet meets the requirements for the Descriptive Statistics app: it includes at least one time dimension and one measure, and the aggregation type for each measure has been set to Sum. Later in the tutorial, you'll select entity types for your measures. For each measure, you must select an aggregation and entity type combination supported by the app. Since the aggregation for each measure is Sum you must select either None or Currency in the Entity Type field.
In this first part of the tutorial, you'll select the Descriptive Statistics worksheet in the Configure Your Data page, then select the Descriptive Statistics app in Step 1 of the NLG Apps wizard.
Select the Descriptive Statistics worksheet
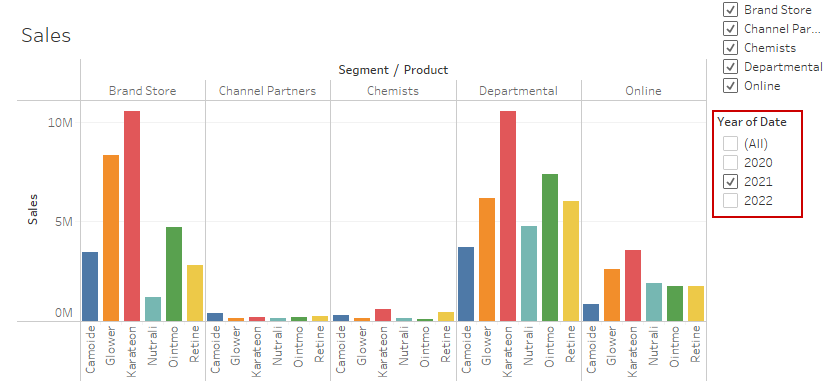
First, select only the data for 2021 using the Year of Date filter at the right of the dashboard. This filter has been configured to apply to the data used for the charts and the Arria for Tableau extension.
Add the Descriptive Statistics worksheet to the dashboard. The Descriptive Statistics worksheet won't be used as a visual, so you can hide it behind the extension.
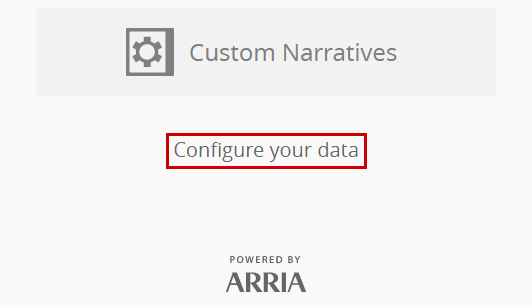
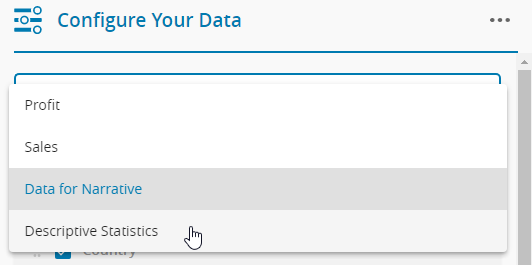
Click Configure Your Data.
Select the Descriptive Statistics worksheet from the dropdown field.
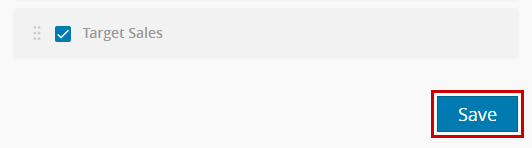
Click the Toggle all data attributes switch to enable all fields and click Save at the bottom of the page.
You're returned to the Getting started with... screen.
Now you're ready to move to Step 1 of the wizard.
Select the Descriptive Statistics app
In Step 1 of the NLG apps wizard, you select the app you want to use to analyze your data.
Note
Refer to the NLG Apps directory reference section for a full description of each NLG app.
Click NLG Apps.
From the list of apps, select Descriptive Statistics.
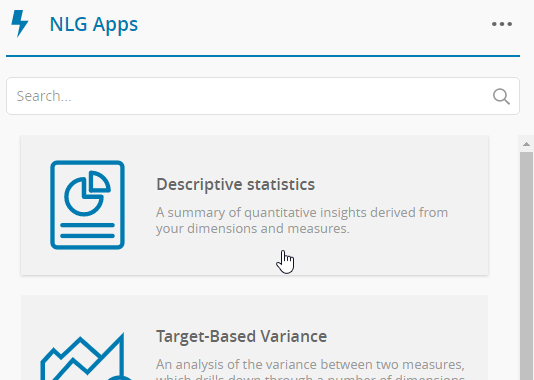
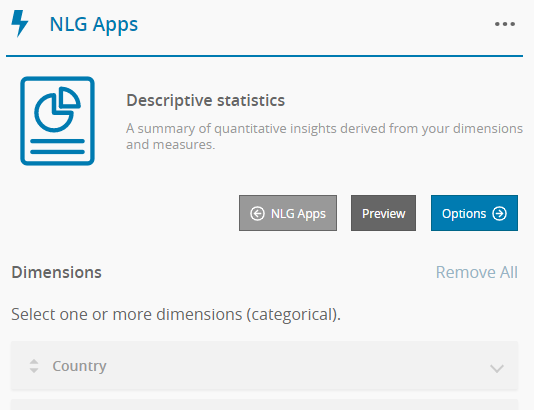
You see the data attributes page for the Descriptive Statistics app.
Note
If your data selection does not meet the specific requirements for a particular app, that app is grayed out and unavailable for selection. A warning message summarizing the data requirements is also displayed.
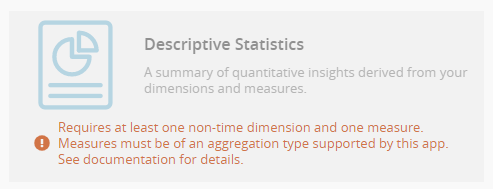
For app-specific data requirements, see the relevant page in the NLG Apps directory.
Next, you'll configure your dimensions and measures as required for the Descriptive Statistics app.
