Trend Analysis
Important
Trend Analysis app updated in Arria for Qlik Sense 3.3.0
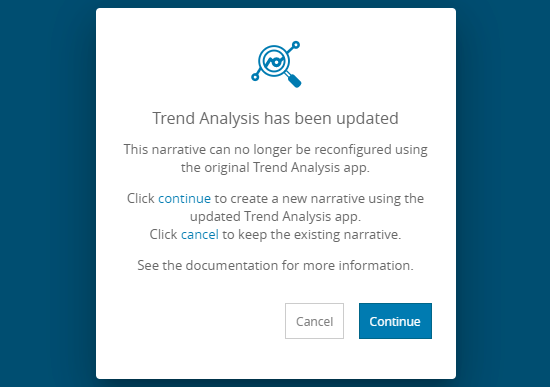
After upgrading to Arria for Qlik Sense 3.3.0, you can no longer reconfigure existing Trend Analysis narratives. When you see the pop-up shown below, click Cancel to keep the existing narrative or Continue to overwrite it and configure a new narrative using the redesigned app.
See NLG Apps optimizations for further guidance.
About the narrative
Details covered in the analysis
A change in the measure's value between periods is categorized as a trend if it equals or exceeds a user-defined threshold percentage. Trends across consecutive periods that move in the same direction are merged into one trend. For example, when analyzing by month, if the measure's value rises in July 2021, August 2021, and September 2021, it is described in the narrative as a single trend from July 2021 to September 2021.
The narrative describes a maximum of three trends: the two most recent trends plus the most significant of all other trends in the series. To focus the analysis on particular periods in the series, filter your data.
The narrative includes:
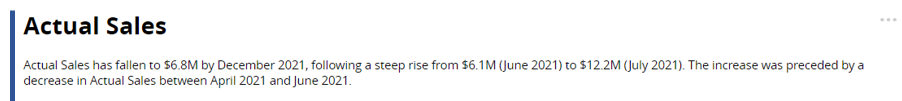
An overview that describes up to three changes in the trend of Actual Sales over the time series (rise to fall, fall to level, fall to rise, etc.).
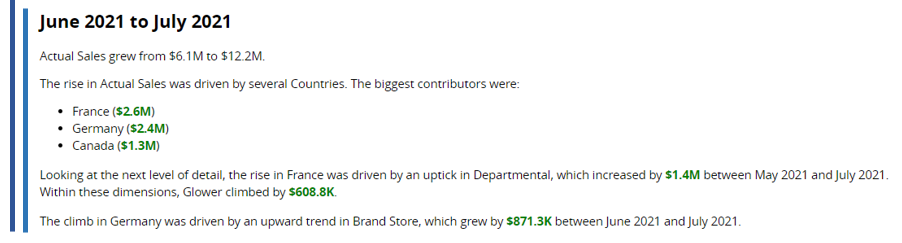
For each change in trend mentioned in the overview: the overall direction of change, peaks and troughs within the trend, an analysis of the key drivers and offsets by Country, and a drilldown by Segment and Product reporting on the single most significant change at those levels (if one exists).
Tip
Set the order of dimension drilldown in Step 2 of the NLG Apps wizard.
See Narrative options for further guidance on configuring the narrative.
Data requirements
All NLG apps have the same data requirements for field names and formats. See Data field names and formats for details.
In addition, each app has specific data requirements:
Dimensions and measures
The requirements for dimensions and measures are:
Minimum | Maximum |
|---|---|
One measure and one time dimension*. | One measure, two time dimensions*, and three additional dimensions. |
*Time dimension requirements for each analysis period:
Analysis period | Required fields |
|---|---|
Month |
|
Quarter |
|
Year |
|
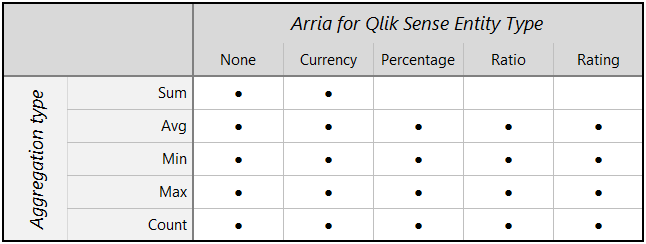
Aggregation and entity types
Not all combinations of aggregation and entity types are supported for measures. The Trend Analysis app can analyze the following combinations:
 |
Note
Entity types and other data attributes are set in Step 2 of the wizard.
Narrative options
You can configure these narrative options in Step 3 of the NLG apps wizard:
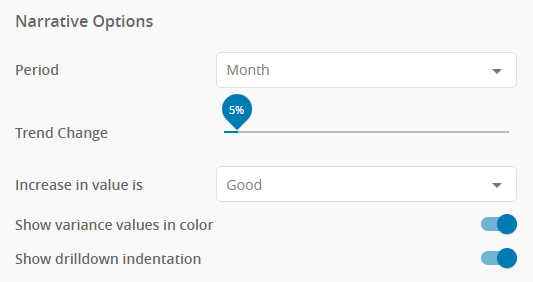 |
Use this option to select the period for comparison. The options are Month, Quarter, and Year.
Default: Month
Your selected data must contain the date fields required for the chosen period:
Period option | Required date fields |
|---|---|
| Date or Year and Month |
| Date or Year and Quarter |
| Date or Year |
This option sets the percentage change threshold for identifying trends. The higher the Trend Change percentage, the more significant a change in the measure's value must be to be included in the narrative.
For example, if you set the Trend Change option to 10% and the measure's value changes by at least ±10% between two periods, the app categorizes the change as an upward or downward trend.
Default: 5%
Note
The narrative describes a maximum of three trends: the two most recent trends plus the most significant of all other trends in the series. To focus the analysis on particular periods in the series, filter your data.
Assume the Use color for variance values option is ON.
Increase in value is | Change | Example narrative |
|---|---|---|
| Sales increased | Sales jumped by $3.2M from $1.6M to $4.8M (196%). |
Sales remained the same | Sales remained stable at around $12.4M. | |
Sales decreased | Sales dropped by $1.3M from $2M to $724.9K (-63.6%). | |
| Expenditure increased | Expenditure rose by $6.6M from $10.5M to $17.1M (63.4%). |
Expenditure remained the same | Expenditure remained stable at around $17.1M. | |
Expenditure decreased | Expenditure fell by $61.5K from $688.4K to $626.9K (-8.94%). | |
| Personnel increased | Personnel increased from $1.5M to $3M (100%). |
Personnel remained the same | Personnel remained stable at around $1.5M. | |
Personnel decreased | Personnel decreased from $3M to $1.5M (-50%). |
See also: Show variance values in color.
This option controls whether the narrative uses color markup to highlight positive and negative outcomes.
When this option is ON:
Green highlights a positive change or outcome.
Red highlights a negative change or outcome.
Default: ON
This option works with the Increase in value is option, which controls which outcomes are considered positive and negative.
Note
The Show variance values in color option has no effect when Increase in value is set to Neutral.
Assume the Use color for variance values option is ON.
Increase in value is | Change | Example narrative |
|---|---|---|
| Sales increased | Sales jumped by $3.2M from $1.6M to $4.8M (196%). |
Sales remained the same | Sales remained stable at around $12.4M. | |
Sales decreased | Sales dropped by $1.3M from $2M to $724.9K (-63.6%). | |
| Expenditure increased | Expenditure rose by $6.6M from $10.5M to $17.1M (63.4%). |
Expenditure remained the same | Expenditure remained stable at around $17.1M. | |
Expenditure decreased | Expenditure fell by $61.5K from $688.4K to $626.9K (-8.94%). |
See also: Increase in value is.
Set this option to ON to indent the narrative at each level of drilldown.
Default: ON
Show drilldown indentation | Example |
|---|---|
| 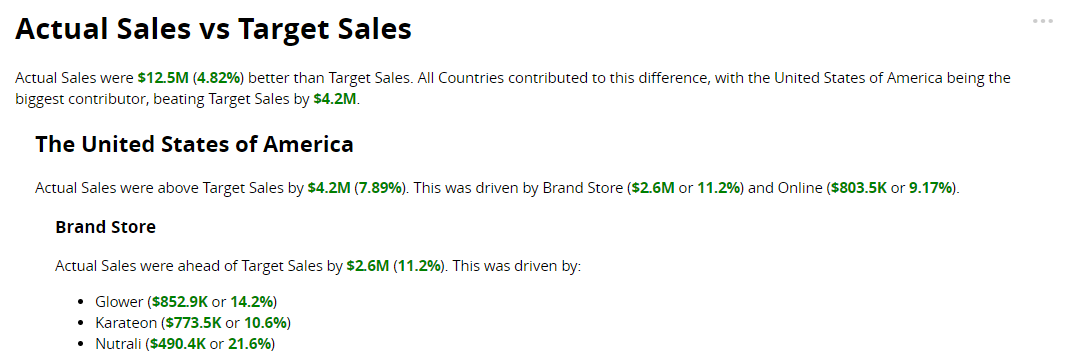 |
| 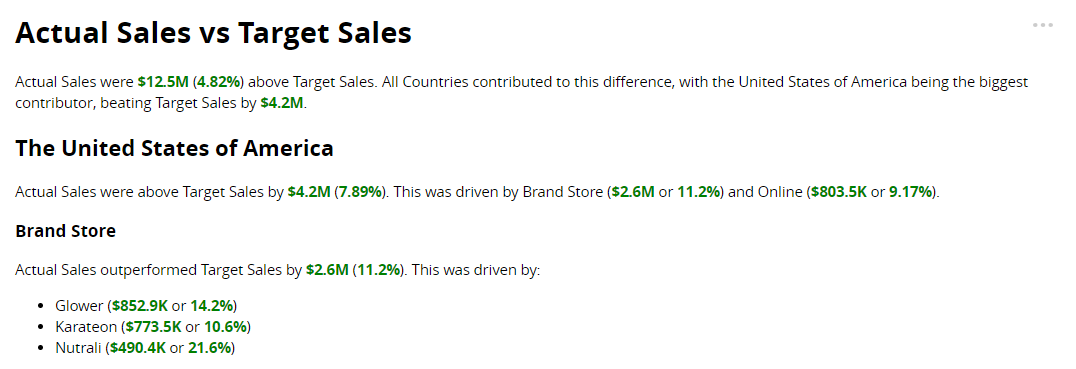 |
