Generate and dynamically modify the narrative
Finally, you'll generate the narrative in your dashboard and dynamically update it using filters.
Click Generate to view the narrative.
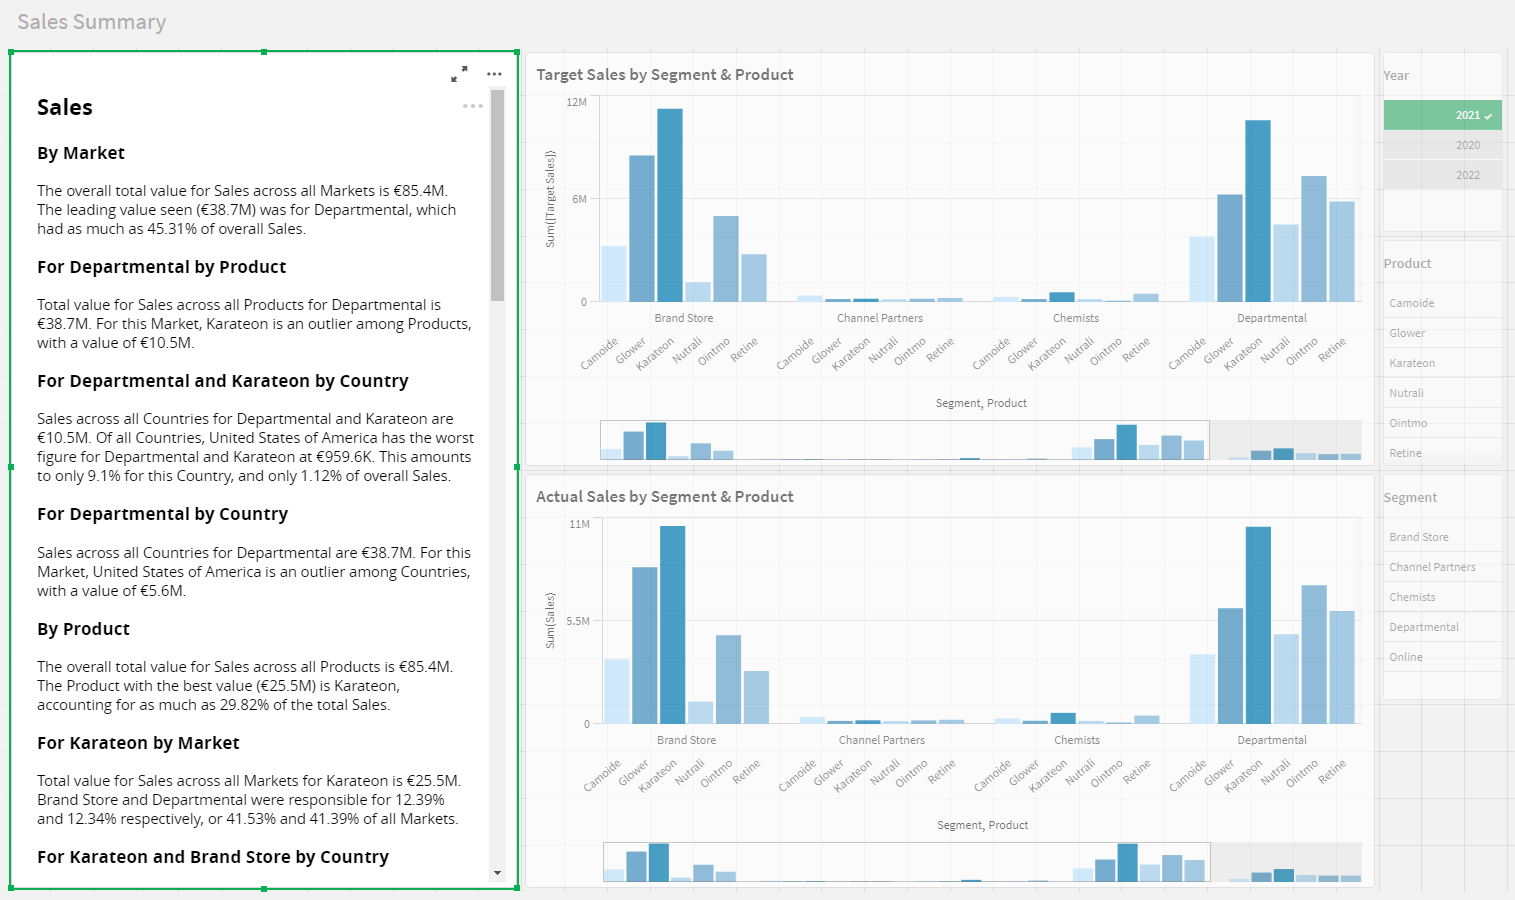
Note the following:
The narrative uses Market instead of Segment because you assigned an alias in Step 2 of the wizard.
The narrative presents the sections for each measure in the order you chose in Step 2 of the wizard.
The analysis for each measure is broken down by dimensions, using the order you chose in Step 2 of the wizard. The app used this order because you selected the
Use selected attribute orderoption in Step 3 of the wizard.
In the Qlik Sense toolbar, click Done editing.
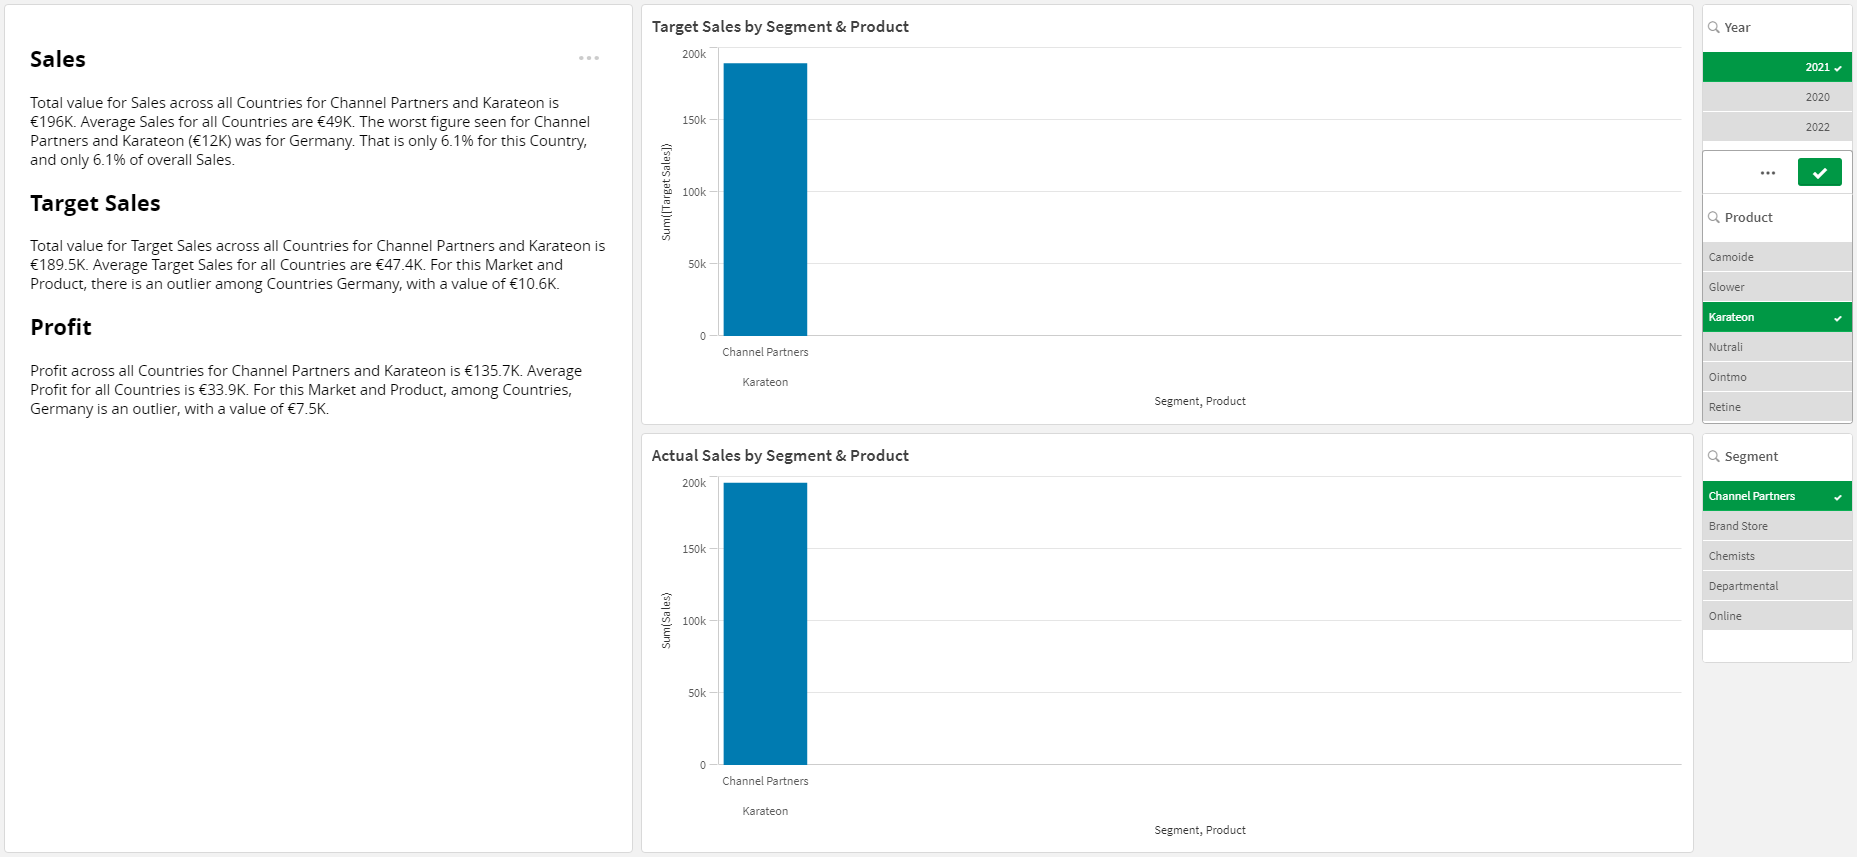
Try using the filters on the right to see how they affect the narrative. For example, filter by the Channel Partners segment and the Karateon product:
Congratulations! You've finished the NLG Apps tutorial.
To learn more about the NLG Apps wizard, and for further guidance on the data requirements and configuration options for each NLG app, please refer to the NLG Apps reference documentation.
