Anomalies
About the narrative
Details covered in the analysis
The Anomalies app calculates the 'normal' values and patterns in a dataset, then identifies data points or ranges that significantly deviate from these norms. Finally, it generates a narrative that highlights and contextualizes the anomalies found.
The anomalies identified by the app fall into three categories:
Global outliers (also known as point anomalies) occur when the value of a single data point differs significantly from all other data points in the dataset. For example:
If Sales of Karateon are significantly higher than Sales of any other Product across the dataset, Karateon is a global outlier.
If Sales in March 2021 are significantly higher than Sales in every other month in the dataset, March 2021 is a global outlier.
Contextual anomalies (also known as seasonal or conditional anomalies) occur when a single data point or a range of data points contains values that are not necessarily outside of the normal global range but are considered abnormal in a specific context. For example:
If Sales in the US usually increase significantly during November and December due to the holiday season but don't increase during November and December 2021, that is a contextual anomaly.
Collective anomalies (also known as continual anomalies) occur when a collection of values deviates significantly from the usual range or pattern observed across the entire dataset. For example:
If the range of Profit values is generally between $1M and $2M but the range of Profit values in April, May, and June 2020 is between $0.5M and $5M, the Profit values for that three-month period are a collective anomaly.
Tip
For contextual and collective anomalies only, use the Sensitivity narrative option to control how much deviation from the norm is considered significant.
The narrative has a section for each measure (e.g. Sales). Each section includes some or all of the following details, depending on your data selection and the type of anomalies that exist in your data:
Outliers
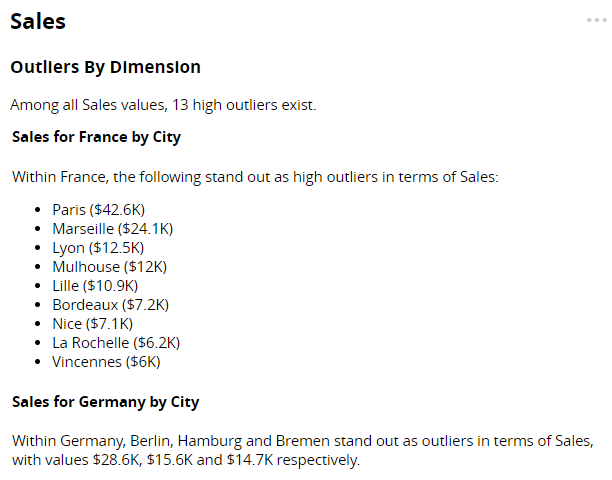
For non-time series data: Outliers by Dimension
When no time dimensions are selected, you get a summary of global outliers and a drilldown analysis that uses between one and three non-time dimensions (e.g. Country, City, and Product). For example:
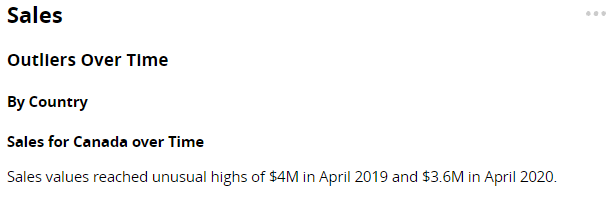
For time series data: Outliers Over Time
When time dimensions are selected (e.g. Month and Year), you get a summary of global outliers over time and a drilldown analysis that uses up to three non-time dimensions (e.g. Country, City, and Product). For example:
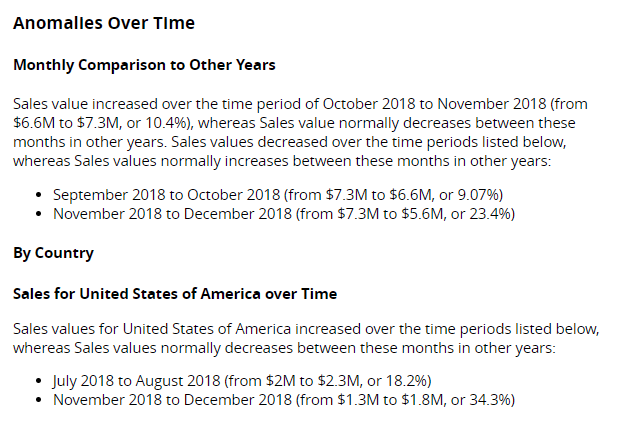
Anomalies Over Time (time series data, only)
Daily/Monthly/Quarterly Comparisons to Other Weeks/Years
This section provides an overview of contextual anomalies and, if non-time dimensions have been selected, a breakdown for each under its own heading (e.g. By Country). For example:
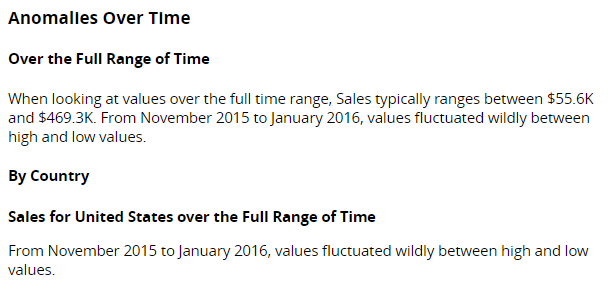
Over the Full Range of Time
This section provides an overview of collective anomalies and, if non-time dimensions have been selected, a breakdown for each under its own heading (e.g. By Country). For example:
Tip
The order in which dimensions are described in the narrative is determined in Step 2 of the NLG Apps wizard.
Note
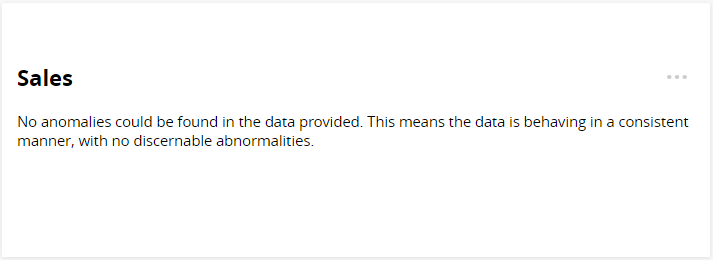
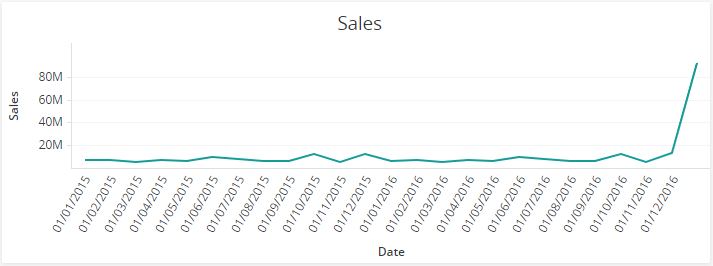
The line graph and the narrative below are generated using the same sales data. At first glance, they may appear to contradict each other: the narrative states that no anomalies were found in the sales data, but the graph seems to show a significant spike.
However, this apparent mismatch is due to the fact that the dataset contains one or more null values (empty cells) for the Date time dimension. Unlike the line chart, the Anomalies app is designed to ignore null values.
 |  |
Data requirements
All NLG apps have the same data requirements for field names and formats. See Data field names and formats for details.
In addition, each app has specific data requirements:
Dimensions and measures
The number of dimensions and measures required depends on whether you're analyzing time series data or non-time series data.
Non-time series data
If your data selection does not contain a time dimension, this app can analyze the following:
Minimum | Maximum |
|---|---|
One measure and one non-time dimension. | Unlimited measures and three non-time dimensions. |
Important
At least seven data points are required in each series. If insufficient data is selected, an error is generated.
Time series data
If your data selection contains a time dimension, this app can analyze the following:
Minimum | Maximum |
|---|---|
One measure and one time dimension*. | Unlimited measures, three time dimensions*, and three non-time dimensions. |
*Time dimension requirements for each analysis period:
Analysis period | Required fields |
|---|---|
Year |
|
Quarter |
|
Month |
|
Day |
|
Important
Global outliers: at least seven data points are required in each series.
Contextual anomalies: at least seven data points are required in each series. In addition, at least three weeks of data are required to report by Day, and at least three years of data are required to report by Month or Quarter.
Collective anomalies: at least nine data points are required in each series.
A maximum of 20 instances of each dimension is reported in the narrative.
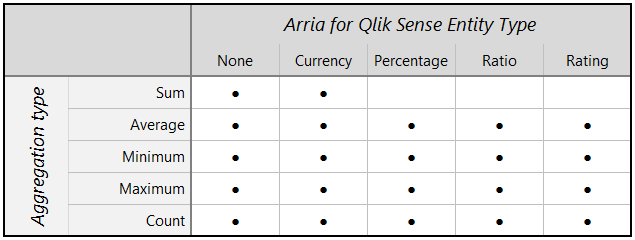
Aggregation and entity types
Not all combinations of aggregation and entity types are supported for measures. The Anomalies app can analyze the following combinations:
 |
Note
Entity types and other data attributes are set in Step 2 of the wizard.
Narrative options
You can configure these narrative options in Step 3 of the NLG apps wizard:
OPTION | DESCRIPTION | LOCATION |
|---|---|---|
Period | Select a time period to analyze. The time dimensions in your data selection must include the period you select here — either as a Date field, or as Day, Month, Quarter, or Year fields. Default: | 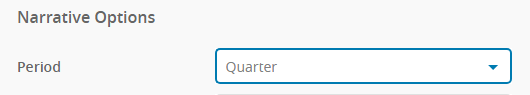 |
Sensitivity | For contextual and collective anomalies only, control how sensitive the Anomalies algorithm is to deviations from the expected pattern or range of values in your data. At a sensitivity of 100, even a slight deviation is considered an anomaly. At a sensitivity of 0, only major deviations are considered anomalies. This field is available only when your data selection contains a time dimension. Default: |  |
