Select the data to be analyzed
In this tutorial, you'll generate a narrative using the Descriptive Statistics app. Before selecting the data fields to be analyzed, you must consider the data requirements for this app.
Some data requirements — supported formats and field names — are the same for each NLG app. See NLG Apps reference > Data field names and formats for details.
Other data requirements — the minimum number of required fields and the supported combinations of aggregation and entity types — vary by app. You can find these details in the NLG Apps Directory.
The Descriptive Statistics app has the following requirements:
Minimum number of fields: one measure and one non-time dimension.
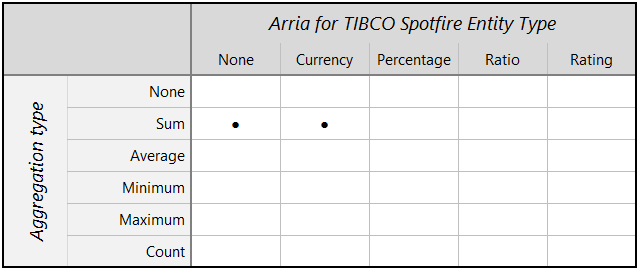
Supported combinations of aggregation and entity types:
Now, you'll add three dimensions and three measures (aggregated by Sum) to the Intelligent Narratives visualization.
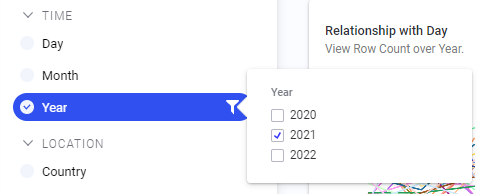
First, in TIBCO Spotfire Analyst, open the Data in analysis flyout and select only the data for 2021 by filtering the Year field.
In the Intelligent Narratives visualization, click the Legend icon to close the legend.
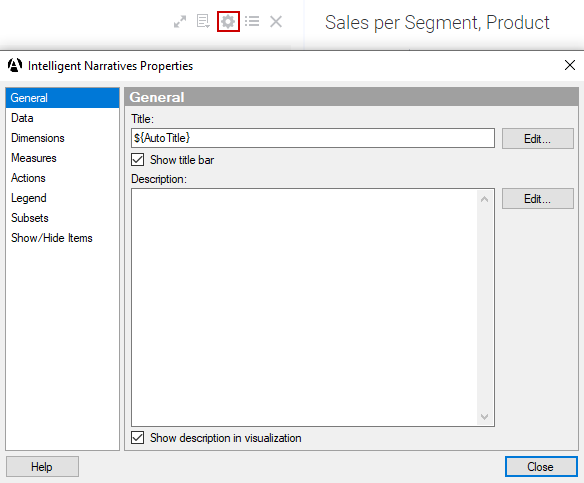
Click the Properties icon to access the Intelligent Narratives Properties pop-over.
Next, you'll add the columns you'd like to analyze. TIME, LOCATION, and CATEGORIES columns are added to the Dimensions section and NUMBERS columns are added to the Measures section. See Data field names and formats for more information.
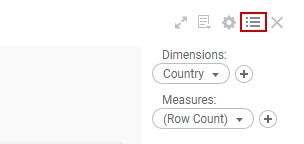
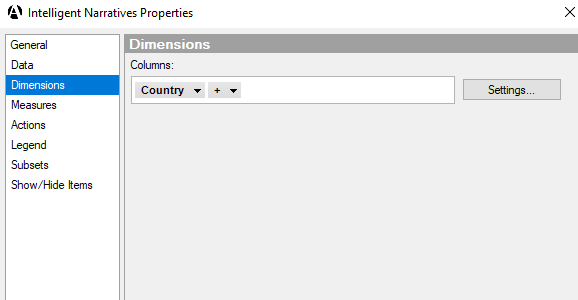
On the left, click Dimensions. By default, Dimensions is already populated with one column: in this case, Country.
In the Columns selector field, click the Plus icon and add the Product column.
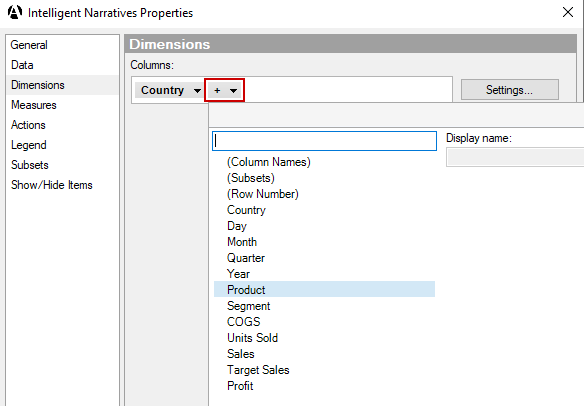
Repeat Step 5 to add the Segment column.
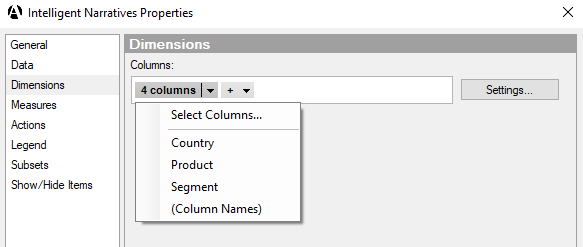
You're nearly ready to start adding NUMBER columns to the Measures section. First, you need to add (Column Names) to the Dimensions section. This is required whenever you wish to analyze more than one NUMBER.
Repeat Step 5 to add (Column Names).
You now have the following columns in the Dimensions section:
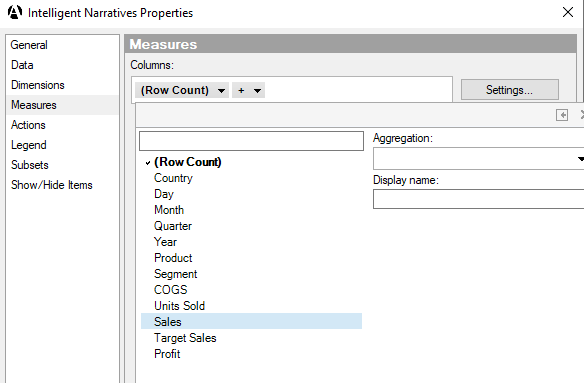
On the left, click Measures. By default, Measures is already populated with one column: (Row Count).
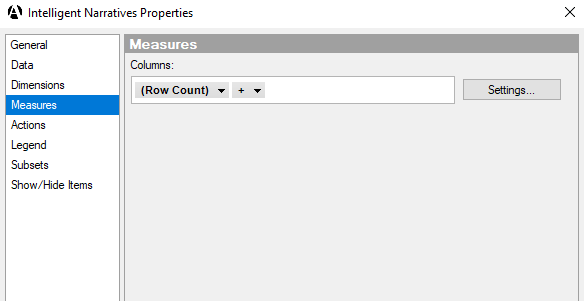
In the Columns selector field, click (Row Count) and change it to Sales. Leave the aggregation type as Sum.
Add the Target Sales and Profit columns, leaving the aggregation type as Sum for each.
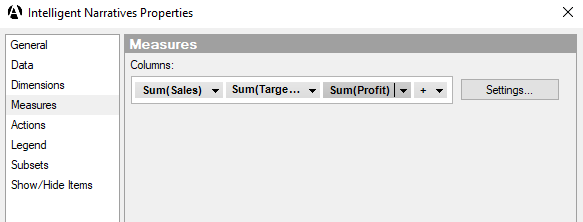
Close the Intelligent Narratives pop-over.
You've added three dimensions (Product, Country, and Segment) and three measures (Profit, Sales, and Target Sales). Next, you'll select the Descriptive Statistics app in Step 1 of the NLG Apps wizard.
