Add Arria for TIBCO Spotfire to an analysis
This topic describes how to add the Arria for TIBCO Spotfire Intelligent Narratives visualization mod to your analyses and select the data to be analyzed.
Note
This procedure was created using TIBCO Spotfire Analyst. You may notice minor differences when using other TIBCO Spotfire clients.
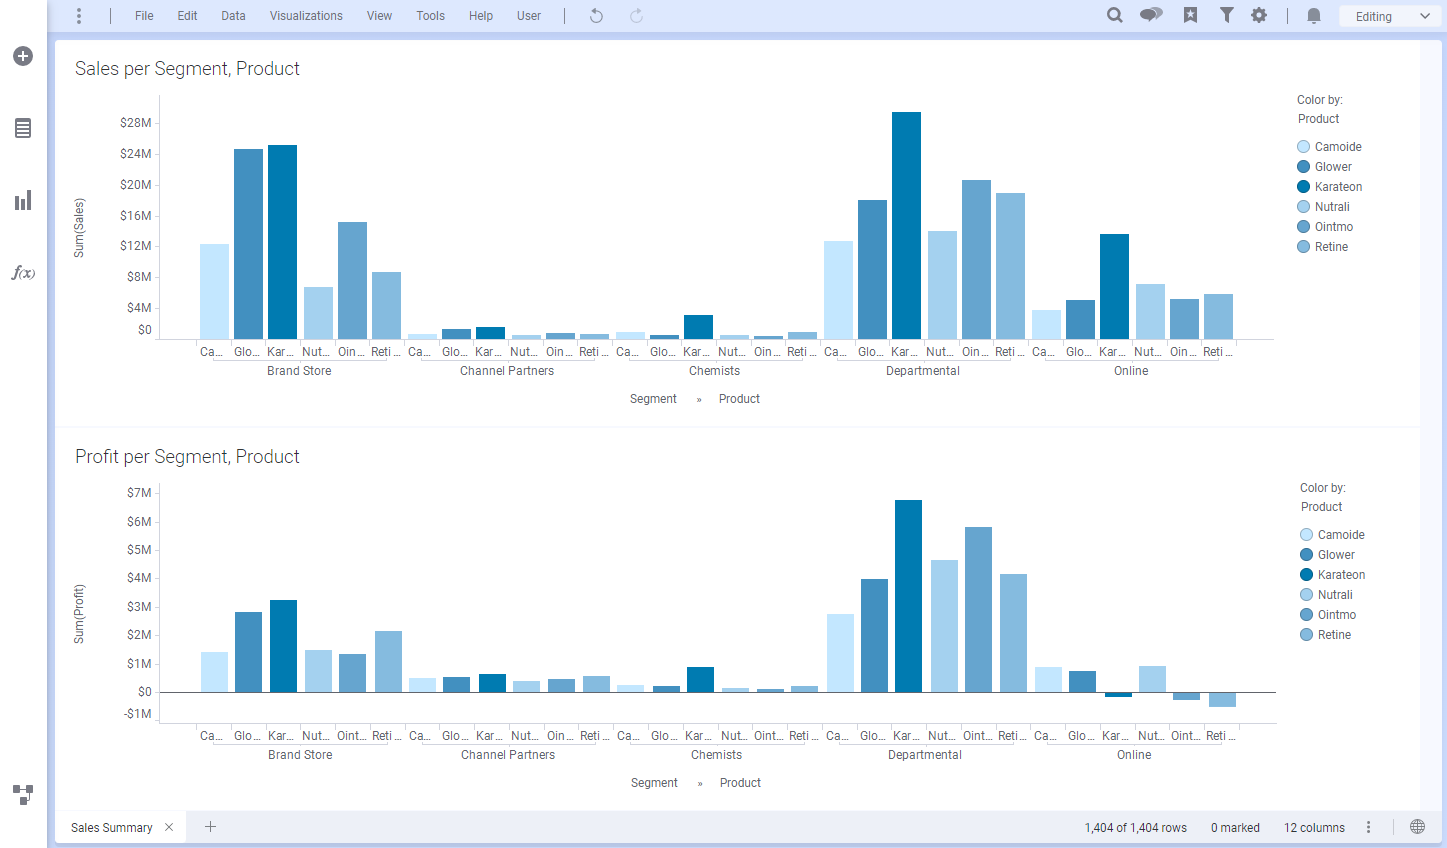
In TIBCO Spotfire, open the analysis you want to add the narrative to.
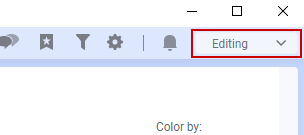
Make sure you are in Editing mode (at the top right of the Authoring bar).
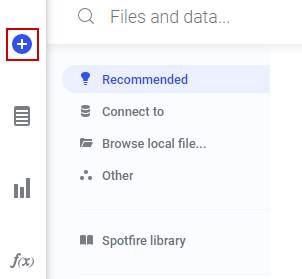
In the Authoring bar, click the Files and data icon to open the flyout.
Arria's Intelligent Narratives visualization mod can be added from the Spotfire library or from a local visualization mod file.
Tip
If your TIBCO Spotfire client is connected to TIBCO Spotfire Server, your TIBCO Spotfire Server administrator must enable the Open Visualization Mod from Library and/or Open/Save Local Visualization Mod options, as well as the Trust Mods option, in the TIBCO Spotfire Extensions License section of the appropriate User Group(s).
Add from the Spotfire library
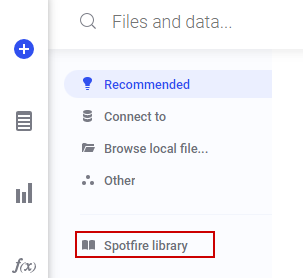
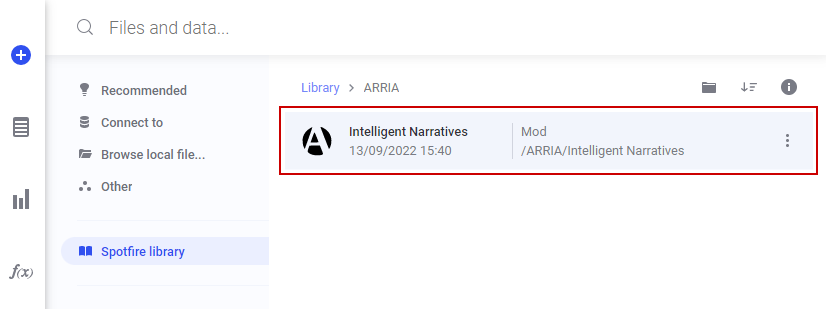
If the Intelligent Narratives visualization mod has been saved to the Spotfire library, select Spotfire library.
Search the library for 'Intelligent Narratives', or browse the library to find it.
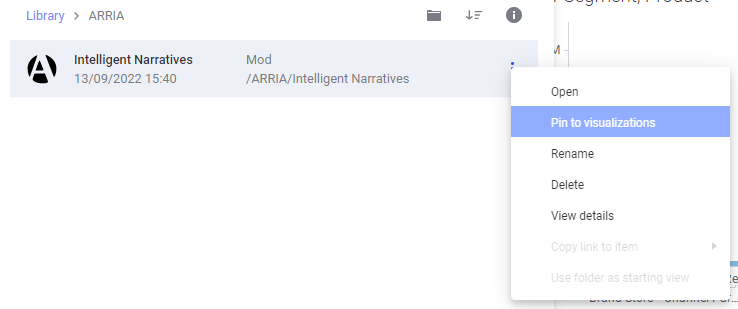
Double-click on the mod to add it to the analysis, or select Open from the menu on the right (accessible from the three dots icon).
Visualization mods saved to the library can be pinned to the Visualizations menu so they're easier to find in future.
Add from a local visualization mod file
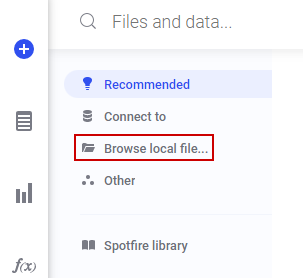
To add the Intelligent Narratives visualization mod from a file downloaded from the Arria website, select Browse local file....
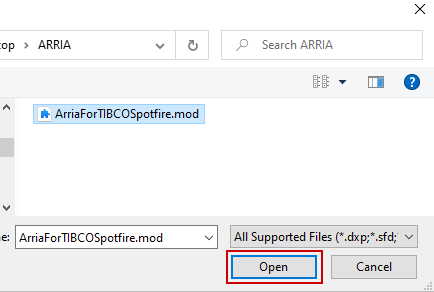
Navigate to the ArriaForTIBCOSpotfire.mod file and click Open.
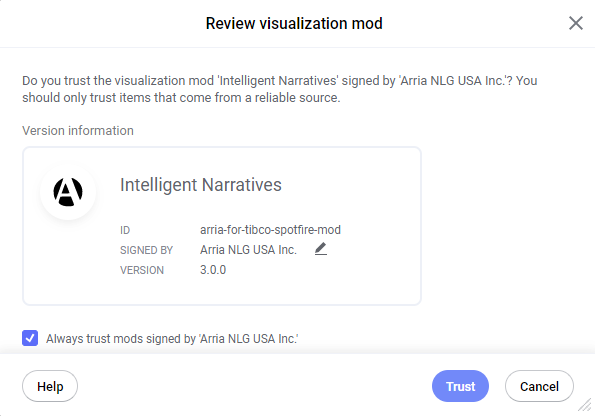
You may see a pop-over asking you to trust the Intelligent Narratives visualization mod. Optionally check the Always trust mods signed by 'Arria NLG USA Inc.' box, then click Trust.
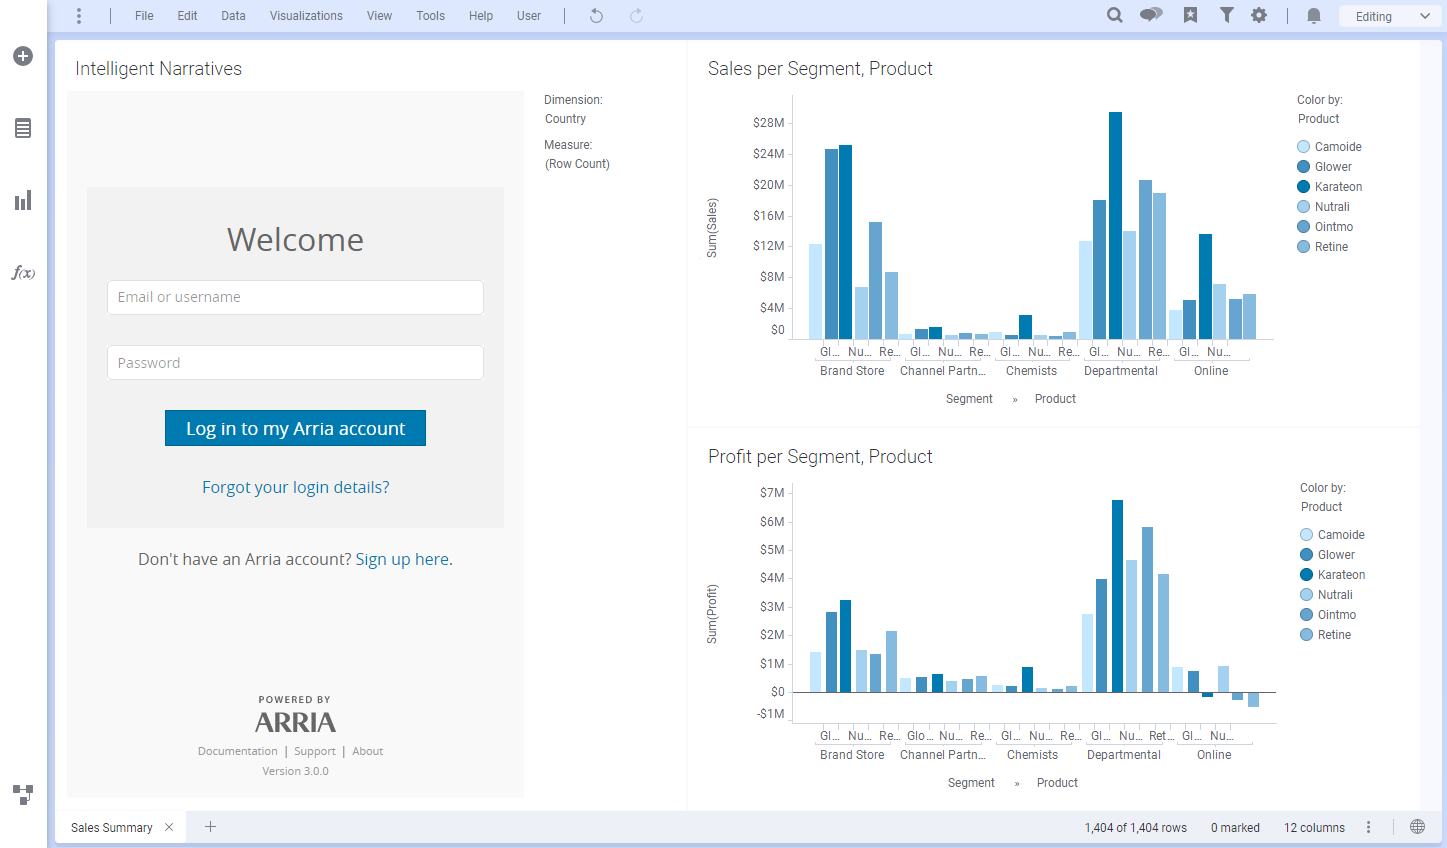
The Intelligent Narratives visualization is added to the analysis and you see the Welcome page.
Move and resize the visualization as required.
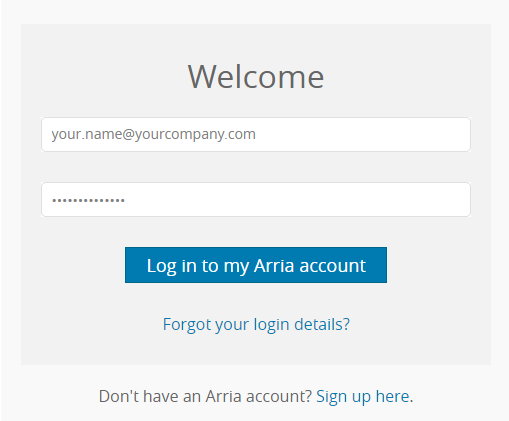
Enter your Arria account credentials and click Log in to my Arria account.
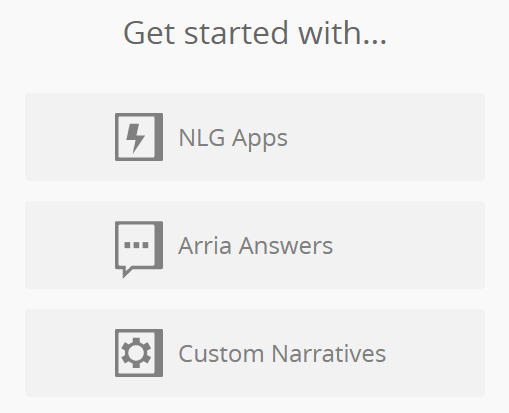
You are presented with the Get started with... page:
In the Intelligent Narratives visualization, click the Legend icon to close the legend.
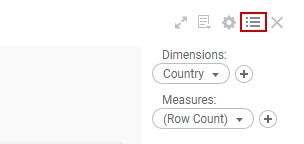
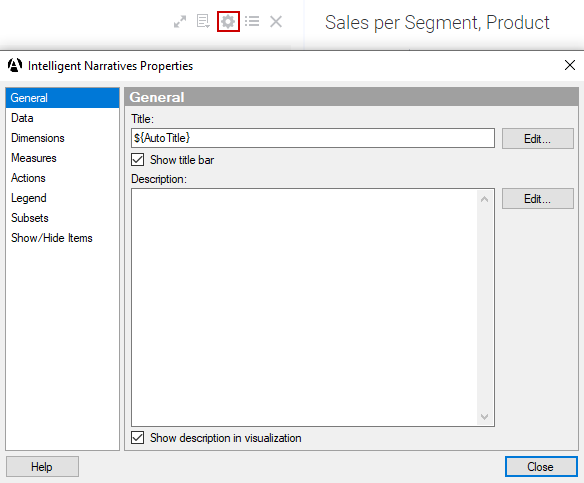
Click the Properties icon to access the Intelligent Narratives Properties pop-over.
Next, you'll add the columns you'd like to analyze. You must add TIME, LOCATION, and CATEGORIES columns to the Dimensions section and NUMBERS columns to the Measures section. See Data field names and formats for more information on dimensions and measures.
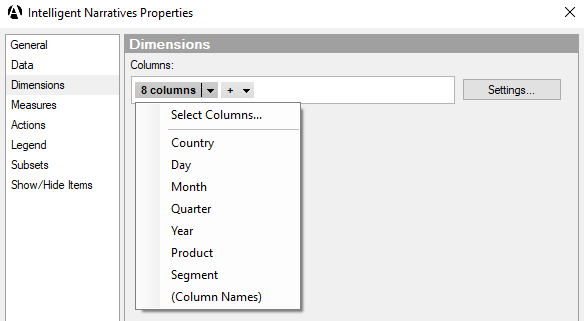
On the left, click Dimensions. By default, Dimensions is already populated with one column. For example, Country.
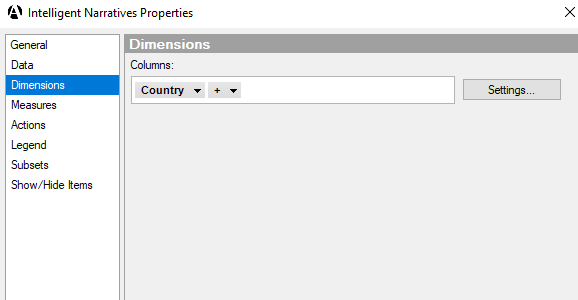
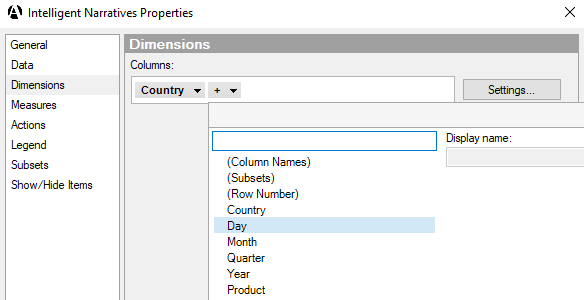
In the Columns selector field, click the Plus icon and add another TIME, LOCATION, or CATEGORIES column. For example, Day:
Repeat Step 4 to add the rest of the TIME, LOCATION, and CATEGORIES columns you'd like to analyze.
You're nearly ready to start adding NUMBER columns to the Measures section. First, if you wish to analyze more than one NUMBER column, you need to add (Column Names) to the Dimensions section.
Add the (Column Names) column.
The Dimensions section should now look something like this:
On the left, click Measures. By default, Measures is already populated with one column: (Row Count).
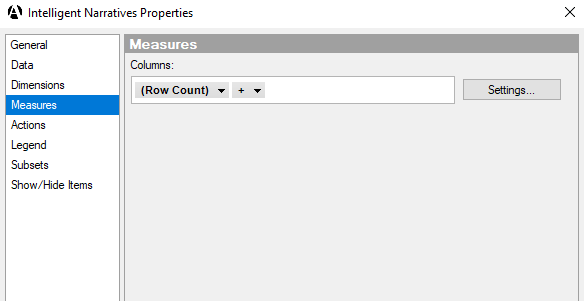
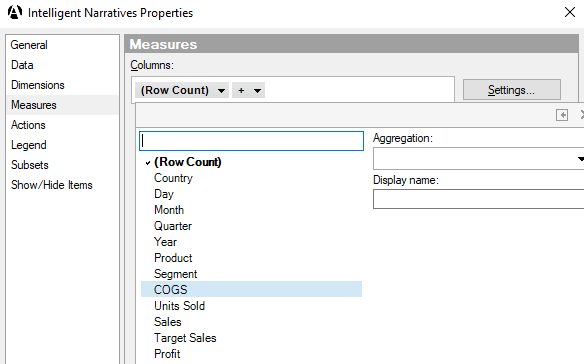
In the Columns selector field, click (Row Count) and change it to one of your NUMBER columns. For example, COGS. Leave the aggregation type as Sum.
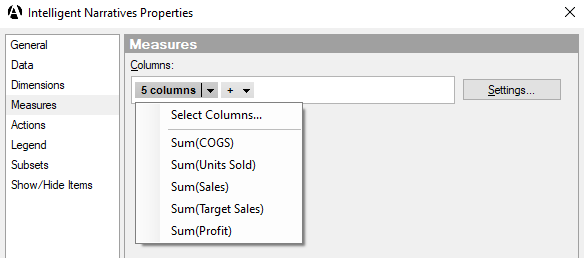
Add the rest of the NUMBERS columns you'd like to analyze, leaving the aggregation type as Sum for each.
The Measures section should now look something like this:
Close the Intelligent Narratives pop-over.
You're now ready to select NLG Apps, Arria Answers, or Custom Narratives from the Get started with... page and begin analyzing your data!
