Correlations
About the narrative
Details covered in the analysis
The Correlations app detects correlations in a dataset and generates a narrative that describes them in terms of strength (very weak to very strong) and direction (positive or negative).
A positive correlation is indicated when the values in two data series are both high, both low, or are changing in the same direction. For example, Profit may be high when Sales are high.
A negative (or inverse) correlation is indicated when the values in one data series are high/rising as the values in the other data series are low/falling (and vice versa). For example, Profit may decrease as Cost of Goods Sold increases.
Tip
A correlation between dimensions or between measures does not necessarily mean that a change in one is caused by a change in the other.
The app can be used to analyze:
One measure, to identify correlations between different dimensional breakdowns. For example:
For non-time series data:
For time series data:
Two measures, to determine if they are correlated in terms of overall values and across different dimensional breakdowns. For example:
For non-time series data:
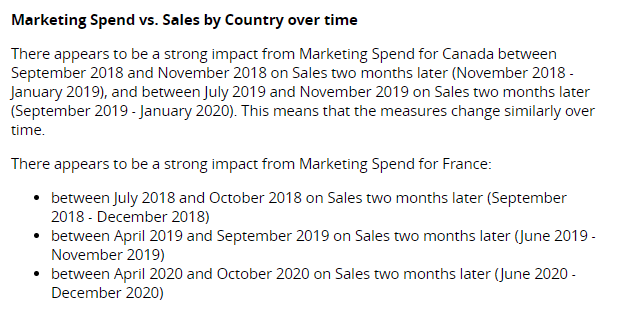
For time series data:
For time series data with time shift:
Tip
When looking for correlations between two measures, set one as the Primary Measure and one as the Secondary Measure in Step 2 of the wizard to determine the order in which they are compared. The selected order is particularly important when considering whether a change to one measure may be causing a change in the other.
The order in which dimensions are described in the narrative is also determined in Step 2 of the NLG Apps wizard.
Data requirements
All NLG apps have the same data requirements for field names and formats. See Data field names and formats for details.
In addition, each app has specific data requirements:
Dimensions and measures
The number of dimensions and measures required depends on whether you're analyzing time series data or non-time series data.
Non-time series data
If your data selection does not contain a time dimension, this app can analyze the following:
Minimum | Maximum |
|---|---|
One measure and two non-time dimensions or two measures and one non-time dimension. | Two measures and three non-time dimensions. |
Note
At least four data points are required in each series. If insufficient data is selected, an error is generated.
A maximum of 20 instances of each dimension is reported in the narrative.
Time series data
If your data selection contains a time dimension, this app can analyze:
Minimum | Maximum |
|---|---|
One measure, one time dimension*, and one non-time dimensions or two measures and one time dimension*. | Two measures, three time dimensions*, and three non-time dimensions. |
*Time dimension requirements for each analysis period:
Analysis period | Required fields |
|---|---|
Year |
|
Quarter |
|
Month |
|
Day |
|
Note
At least four data points are required in each series. In addition, at least two instances of each non-time dimension are needed.
A maximum of 20 instances of each dimension is reported in the narrative.
Aggregation and entity types
Not all combinations of aggregation and entity types are supported for measures. The Correlations app can analyze the following combinations:
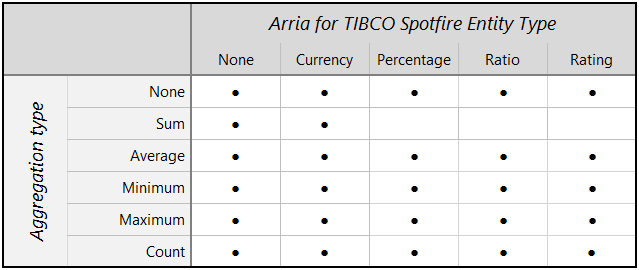 |
Note
Entity types and other data attributes are set in Step 2 of the wizard.
Narrative options
You can configure these narrative options in Step 3 of the NLG apps wizard:
OPTION | DESCRIPTION | LOCATION |
|---|---|---|
Period | Select a time period to analyze. The time dimensions in your data selection must include the period you select here — either as a Date field, or as Day, Month, Quarter, or Year fields. Default: | 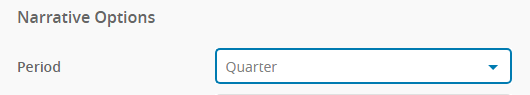 |
Time Shift Interval | When looking for correlations between two time series, select the interval (number of periods) by which to shift the secondary time series. If a correlation is found, it may indicate that the primary series has a delayed effect on the secondary series. A time shift can only be applied to correlation analysis if your data contains This field is available only when both a primary and secondary measure have been configured in Step 2 of the wizard, and your data selection contains a time dimension (time series data). Default: | 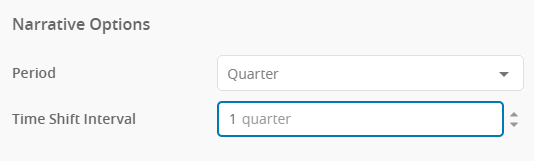 |
