Generate and modify the narrative
Finally, you'll generate the narrative in your dashboard and dynamically update it using filters.
Click Generate to view the narrative.
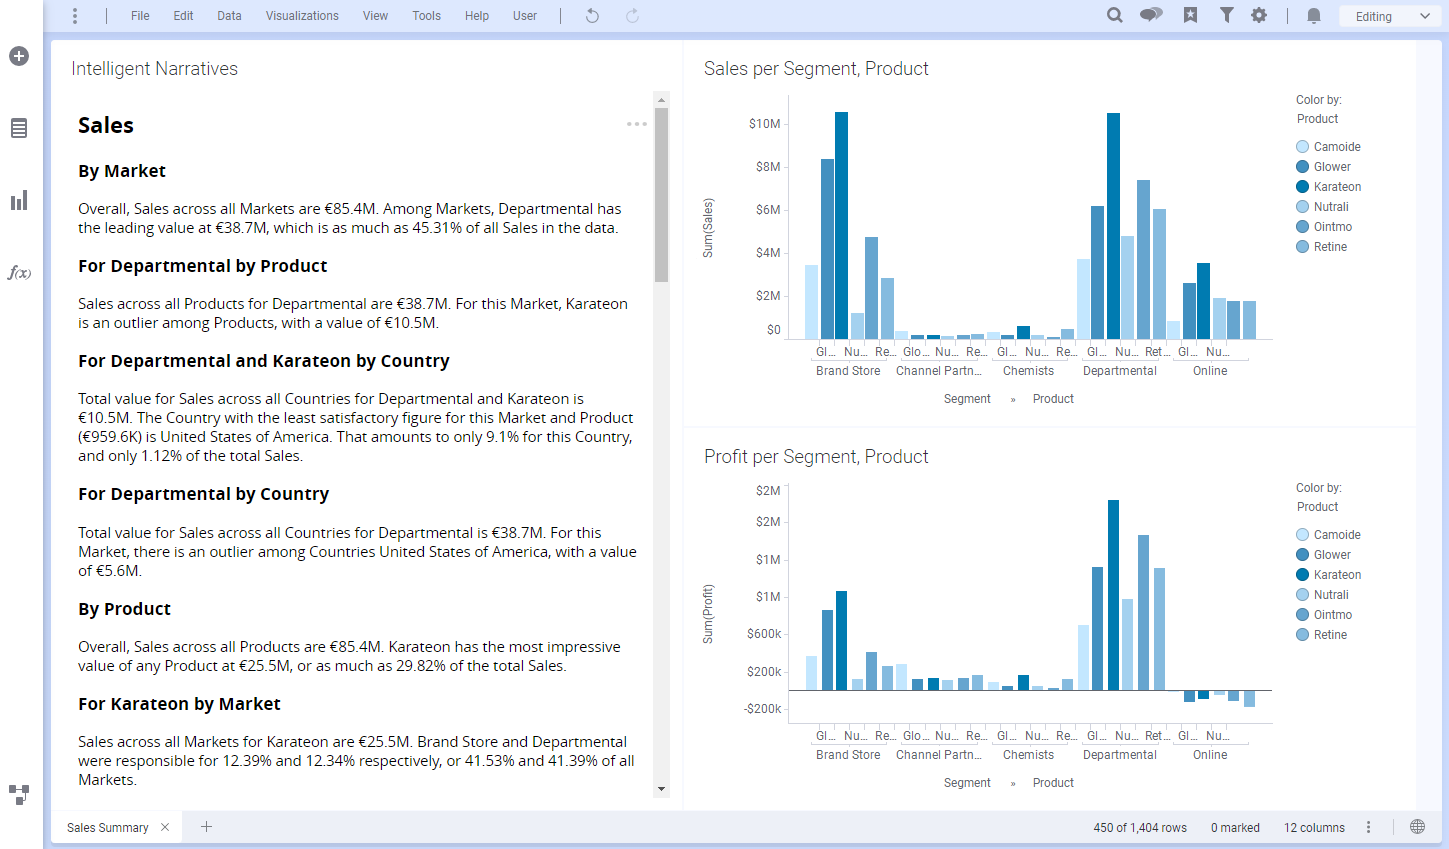
Note the following:
The narrative uses Market instead of Segment because you assigned an alias in Step 2 of the wizard.
The narrative presents the sections for each measure in the order you chose in Step 2 of the wizard.
The analysis for each measure is broken down by dimensions, using the order you chose in Step 2 of the wizard. The app used this order because you selected the
Use selected attribute orderoption in Step 3 of the wizard.Measure values are formatted as the EURO currency.
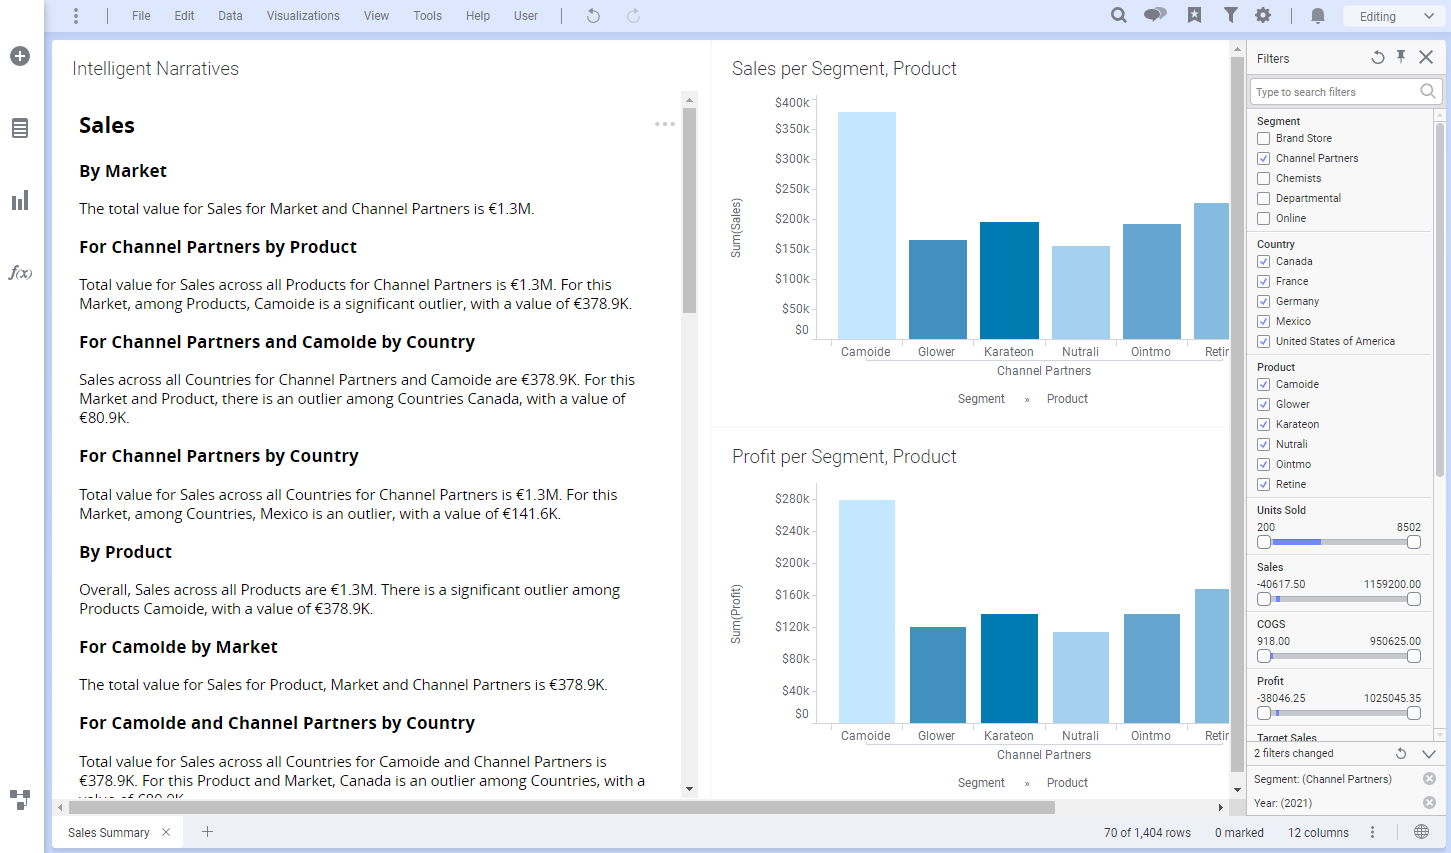
Try using filters to see how they affect the narrative. For example, filter by the Channel Partners segment:
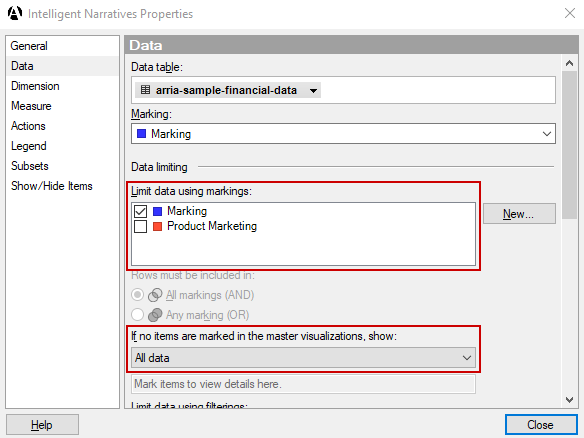
To allow the TIBCO Spotfire Marking feature to control narrative content, go to Intelligent Narratives Properties > Data section and do the following:
enable Marking in the Limit data using markings field.
select All data in the If no items are marked in the master visualizations, show field.
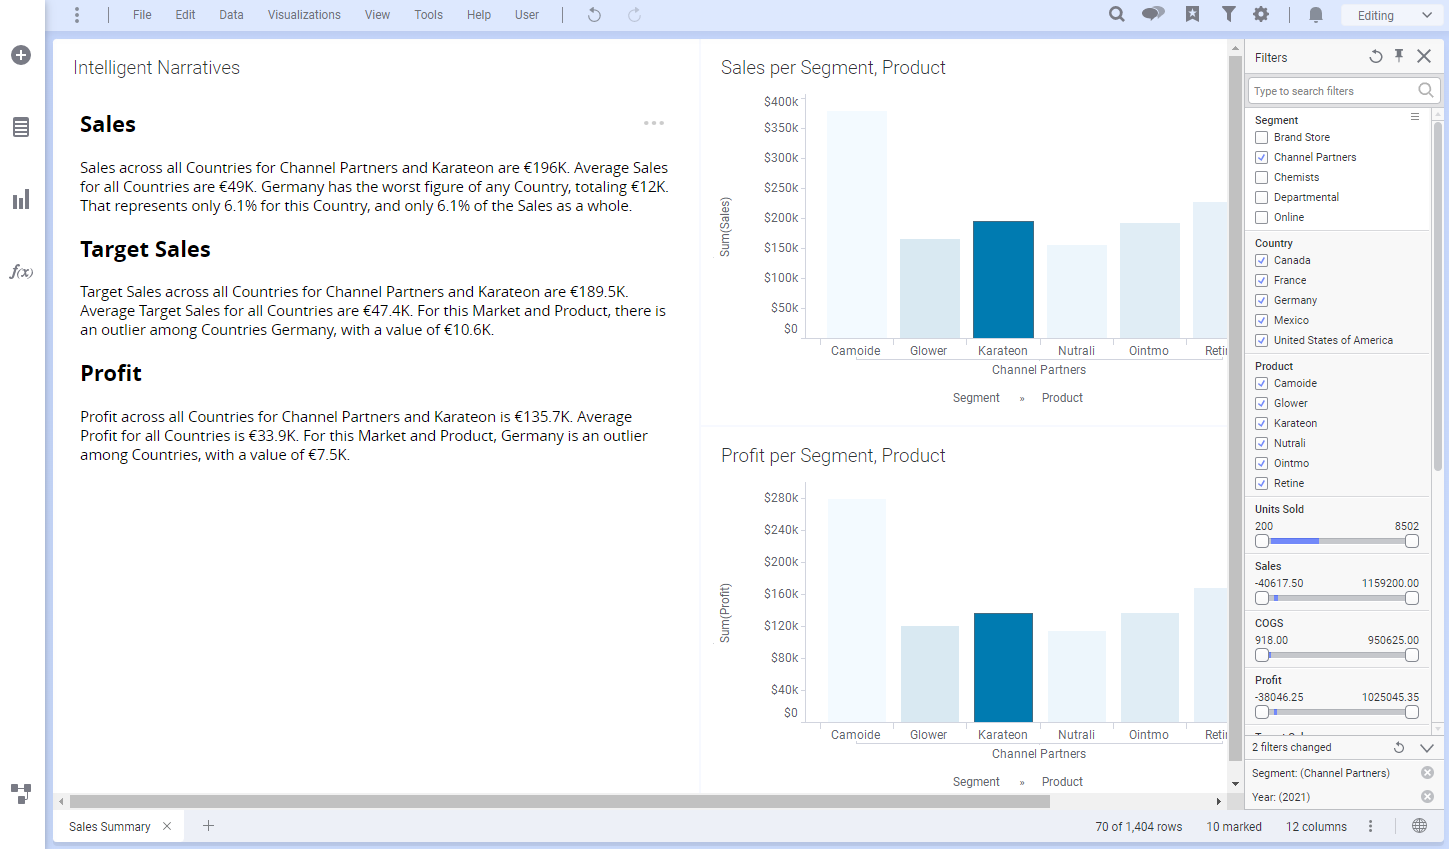
Now try marking Karateon in the Sales per Segment, Product visual and notice the effect it has on the narrative:
To reconfigure the narrative, click the ellipsis icon at the top right of the Intelligent Narratives visualization and select NLG Apps.
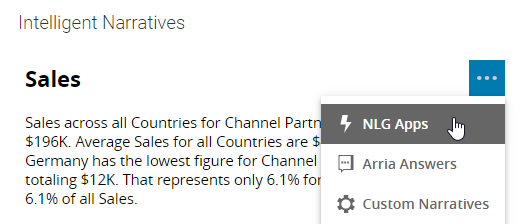
You can now make adjustments to your data configuration and narrative options using the NLG Apps wizard.
Congratulations! You've finished the NLG Apps tutorial.
To learn more about the NLG Apps wizard, and for further guidance on the data requirements and configuration options for each NLG app, please refer to the NLG Apps reference documentation.
