Select data for Arria Answers
The next step is to select the data fields you'd like to analyze using Arria Answers.
In the Intelligent Narratives visualization, click the Legend icon to close the legend.
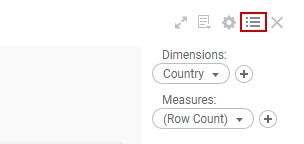
Click the Properties icon to access the Intelligent Narratives Properties pop-over.
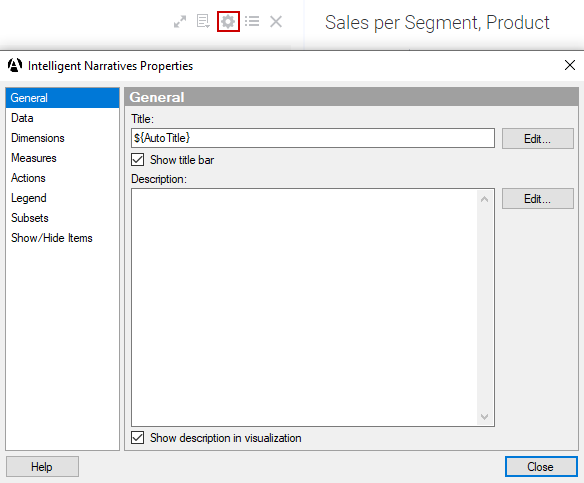
Next, you'll add the columns you'd like to analyze. You must add TIME, LOCATION, and CATEGORIES columns to the Dimensions section and NUMBERS columns to the Measures section. See Data field names and formats for more information on dimensions and measures.
On the left, click Dimensions. By default, Dimensions is already populated with one column: in this case, Country.
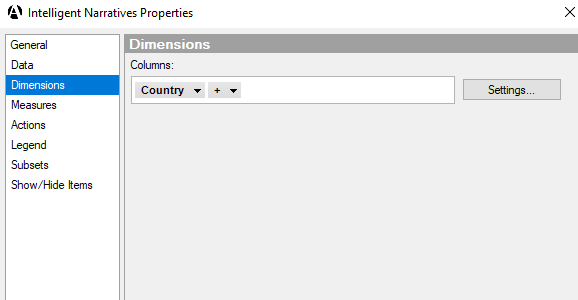
In the Columns selector field, click the Plus icon and add the Day column.
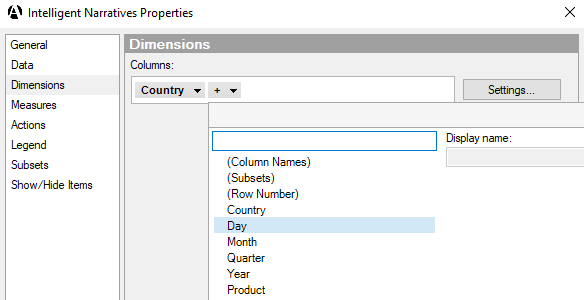
Repeat Step 4 to add the Month, Quarter, Year, Product, and Segment columns.
You're nearly ready to start adding NUMBER columns to the Measures section. First, you need to add (Column Names) to the Dimensions section. This is required whenever you wish to analyze more than one NUMBER.
Add the (Column Names) column.
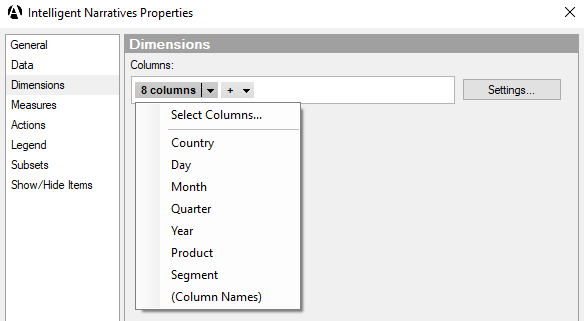
You now have the following columns in the Dimensions section:
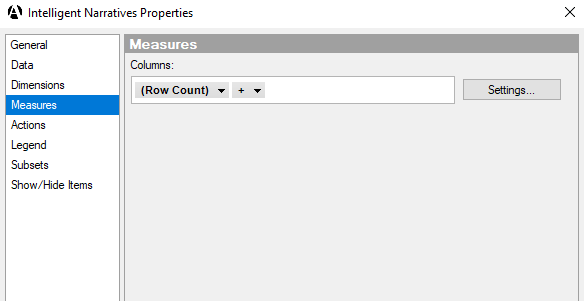
On the left, click Measures. By default, Measures is already populated with one column: (Row Count).
In the Columns selector field, click (Row Count) and change it to COGS. Leave the aggregation type as Sum.
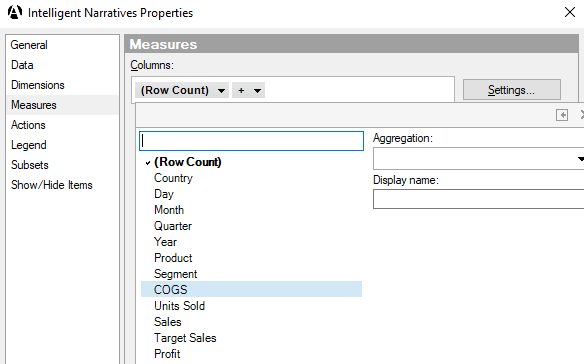
Add the Units Sold, Sales, Target Sales, and Profit columns, leaving the aggregation type as Sum for each.
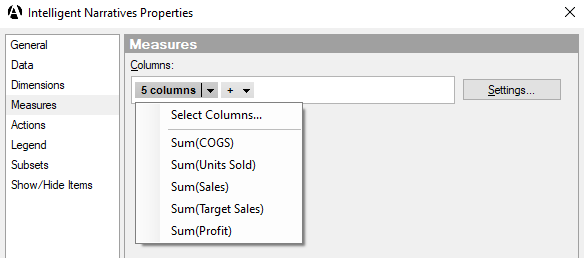
You now have the following columns in the Measures section:
Close the Intelligent Narratives pop-over.
You've now added all fields to the visual. Next, you’ll configure these fields using the Arria Answers wizard.