Select data for Arria Answers
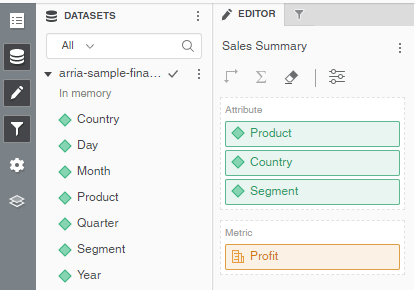
You have already selected Product as an attribute and Profit as a metric. This was the bare minimum required for opening the visualization. The next step is to add further attributes and metrics to the visualization.
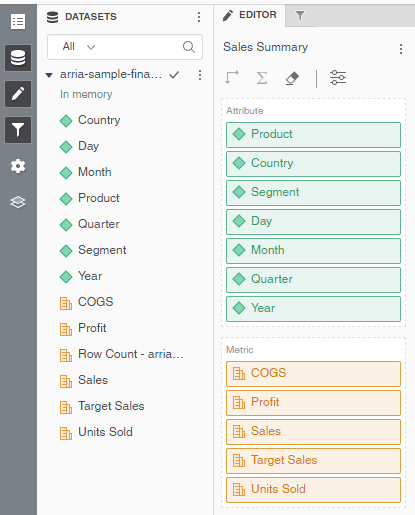
From the Datasets panel, drag Country and Segment to the Attribute section of the Editor panel.
Repeat Step 1 for Day, Month, Quarter, and Year.
Drag COGS, Sales, Target Sales, and Units Sold to the Metric section of the Editor panel.
Check and confirm that the Editor panel looks like this:
Important
The fields do not need to be in the exact order displayed above.
Note
The Arria visualization categorizes MicroStrategy attributes as dimensions, and MicroStrategy metrics as measures.
You've now added all fields to the visualization as dimensions or measures (i.e. attributes or metrics). Next, you’ll configure these fields using the Arria Answers wizard.
